- Francis Généreux
Principal Economist
Weekly Commentary
US Economy: Finding Our Way Through the Fog
October 31, 2025
The monthlong US government shutdown has led to a blackout of critical data that’s interfering with our assessment of US economic conditions. One obvious reason is that indicators usually published by the US federal government haven’t been released, which is also affecting data from other sources. Aside from the consumer price index report for September, which was published specifically for legal reasons related to the Social Security program, the most recent important data released by the federal government was household income and spending for August, which was published at the end of September.
For economists, and everyone who needs to know how the American economy is doing, the lack of data is frustrating. But that’s nothing compared to the shutdown’s wider impact. The direct consequences for many Americans are much more serious—and they’re really starting to bite. Around 900,000 federal employees are going without pay. Unlike previous shutdowns, there’s greater uncertainty about whether furloughed employees will receive retroactive pay. In addition, some public servants are facing the Trump administration’s threat of permanent layoffs. Others are currently required to work without pay, which may be affecting their productivity. The media is reporting increased absenteeism in certain jobs. According to Reuters External link., around 13,000 air traffic controllers and 50,000 TSA agents have had to continue working without pay, and increased absences delayed more than 8,000 flights in the United States last Sunday. We expect certain federal programs will soon be affected, particularly SNAP benefits (food assistance for low-income families), which will likely run out of funding on November 1.
The shutdown will certainly have direct repercussions on the economy. According to the Congressional Budget Office External link. (CBO), most of them are temporary, but their impact will increase the longer the shutdown lasts. The CBO estimated that a four-week shutdown would shave a full percentage point off annualized real GDP growth in the fourth quarter of 2025. This decline would increase to 1.5 points if the stalemate lasts for six weeks, and 2.0 points if it lasts for eight weeks. However, the CBO’s scenarios suggest economic activity in the first quarter of 2026 could be boosted by a rebound in spending once the shutdown is resolved. It nevertheless pointed out that all of these estimates involve considerable uncertainty.
This uncertainty is compounded by the current murky state of affairs. Fed Chair Jerome Powell described it as “driving in the fog” in this week’s press conference. “What do you do if you’re driving in the fog? You slow down,” he said. The growing lack of clarity around the US economy could prompt investors and businesses to act more cautiously, or even delay key decisions, which may slow growth.
Normally, job creation data for October would be released next Friday, but the official numbers for September still haven’t been published. Third-quarter real GDP also hasn’t been released, and neither were the household income and consumer spending figures for September. Data on orders, sales and private inventory investment is also unavailable. Although analysts and investors have been paying close attention to trade policy, the most recent comprehensive data on imports and exports, including detailed information on tariff inflows, is from July.
The lack of essential data like this presents a significant challenge. In addition, the shutdown may even prevent the collection of the data used to compile these indicators. The White House has already said that the October consumer price index may not be released.
So that’s what we don’t know about the economy. But what do we know? Other indicators that aren’t produced by the federal government give us some idea of current economic trends.
The Job Market
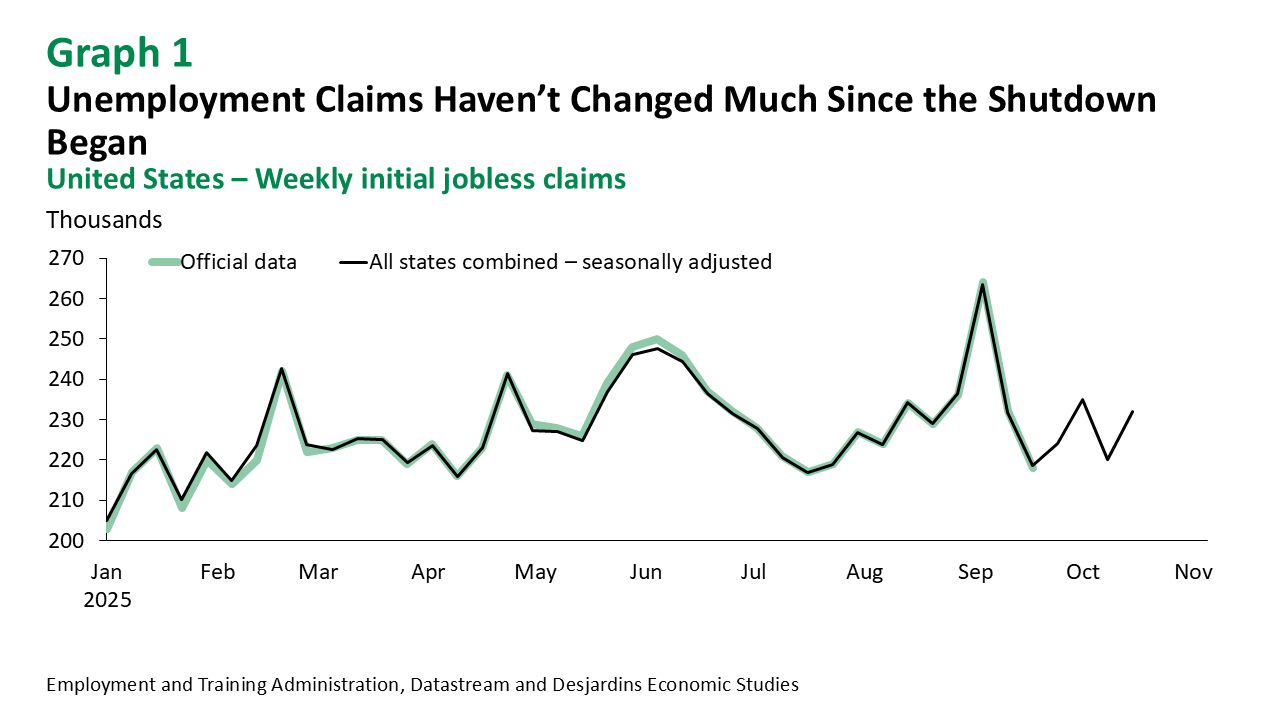
Monthly job creation data is probably the indicator that’s most closely watched by analysts and the market. While we’ve seen a slowdown in hiring over the past few months, the data blackout has come at a particularly bad time. However, a few alternative sources of data are available. First, there are weekly unemployment claims. The shutdown has prevented the federal government from releasing national data. But we can figure it out by compiling the data for each state. The most recent figures (for the week ending October 18) aren’t far off the average for the period since August (graph 1). Payroll firm ADP has just started releasing a preliminary estimate of its employment indicator on a weekly basis. According to the estimate, 14,250 jobs were created in the four weeks ending October 11. That’s low, but it isn’t a big shift from the monthly loss of 32,000 jobs in September. Data from Indeed.com shows that job openings edged down over the past month, in keeping with the prevailing trend of recent years. All things considered, it looks like the labour market remains sluggish, but it’s not getting much worse. That said, the effects of layoffs early this year and the indirect consequences of the government shutdown could significantly affect October’s employment figures. Furthermore, big businesses have recently announced job cuts, which we’ll need to keep an eye on, especially through indicators such as the Challenger Job Cut Report. The October print of this report will be published next Thursday.
Prices
Due to a legal obligation, the Bureau of Labor Statistics released September consumer price index data despite the lack of funding. It showed that inflation remained above the Fed’s 2% target. The impact of tariffs is increasingly being felt in goods prices, but service prices are slowing. Without data on producer prices and import/export costs, it’s difficult to evaluate how tariffs are influencing inflationary pressures for businesses. In August, the sharp drop in the trade component of producer prices suggested that businesses were still absorbing most of the cost of tariffs rather than passing it on to consumers. It would be especially frustrating if, at this critical juncture, the shutdown prevents comprehensive inflation figures for October from ever being released.
International Trade
Official final data on US exports and the trade balance haven’t been released since July. Preliminary data for August showed a 1.3% drop in goods exports and a 7% plunge in goods imports. So it seems like trade remains highly volatile, as observed in the first half of 2025.
As for tariffs, we don’t have access to detailed data by imported product and by country of origin for tariffed goods after July. That said, the US Treasury reported tariff revenues of US$30.5B in September—nearly matching August’s US$30.1B and exceeding the US$28.4B collected in July. It appears tariff inflows continue to grow, but the pace of acceleration has largely stalled.
Retail Sales and Consumer Spending
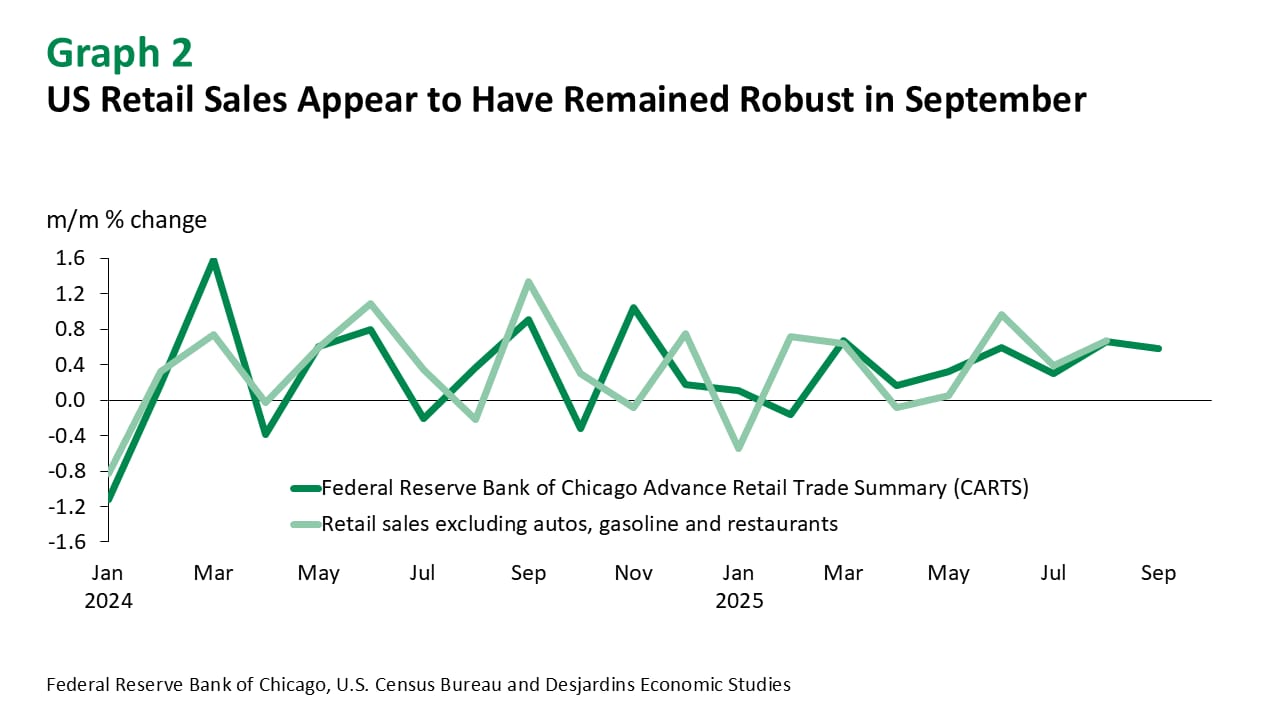
A few indicators can give us an idea of how retail sales have been trending since August, the last time data was released by the Census Bureau. These indicators are generally imperfect and cover only a portion of retail sales transactions. Visa’s Spending Momentum Index, among other indicators, suggests consumer discretionary spending went up slightly in September, but non-discretionary spending went down. The Federal Reserve Bank of Chicago publishes a weekly retail trade summary, which showed fairly strong growth for September (graph 2).
Residential Real Estate
The US housing sector appears to be at a turning point. Existing home sales have struggled for the past few months, while residential investment has trended downwards for several quarters now. Resale prices fell for five consecutive months before rising in August. We don’t have data on housing starts or new home sales after August. But existing home sales jumped 1.5% in September, extending the seesaw pattern observed since the end of 2024. Mortgage applications have nevertheless slowed in recent weeks. Overall, despite the drop in mortgage rates since the summer, the housing market’s direction remains uncertain.
Consumer Confidence and Business Surveys
The major confidence indexes haven’t been affected by the shutdown since none of them are produced by the federal government. In general, the October figures show that consumer sentiment has faded slightly. This is in line with our forecast for more subdued increases in real consumer spending after a few months of surprisingly strong growth in the United States. The government shutdown apparently hasn’t had much of an impact this time. According to the University of Michigan survey, “There was little evidence this month that consumers connect the federal government shutdown to the economy. Only about 2% spontaneously referenced the shutdown during this month’s interviews, compared with the 10% of consumers who did so in January 2019.” The report also stated that “inflation and high prices remain at the forefront of consumers’ minds.”
Meanwhile, business surveys show that the manufacturing sector has stalled, with concerns about the negative impact of tariffs outweighing the potential benefits highlighted by the Trump administration. As for services, the ISM index fell to 50.0 in September, which is exactly the breakeven point between an expansion and contraction of activity.
ISM data for October will be released next week, so we’ll see which direction the services sector is heading. The University of Michigan will also be publishing its preliminary November data on consumer sentiment.
Despite the Fog, US Economic Growth Appears to Be Holding Firm
Based on this information, it appears that growth remains stable in the United States. There haven’t been any radical shifts. A dramatic collapse in confidence or a steep jump in weekly unemployment claims would be the first signs of a downturn. That said, given the direct impact of the government shutdown, we expect more moderate real GDP growth in the fourth quarter and are maintaining our estimate of around 3% growth in the third quarter. The AI boom, and its role in driving business investment, has clearly been a key contributor to growth so far this year. Whether AI will continue to power both economic growth and the stock market rally—which also appears to be lifting investor and consumer sentiment—remains to be seen.
Even though we’re “driving in the fog,” the US economy appears to be moving along a straight path—for now.