- Jimmy Jean, Vice-President, Chief Economist and Strategist
Tiago Figueiredo, Macro Strategist • Oskar Stone, Analyst
Investment Strategy and Interest Rate Analysis
Canadian Assets Are Shining Through Global Fragility
October 1, 2025
Economic Trends and Interest Rates
A new, more volatile era has begun in financial markets.
The post‑pandemic world has given way to military conflicts, rising populism across advanced economies, and mounting fiscal pressures that echo challenges more commonly seen in emerging markets. Reserve currency issuers—once anchors of global stability—now face growing scrutiny over debt sustainability. Multinational firms are rethinking value chains and prioritizing geopolitical resilience over cost‑efficiency as the risks of operating across fragmented jurisdictions become harder to ignore.
This shifting macroeconomic environment is reshaping the policy landscape.
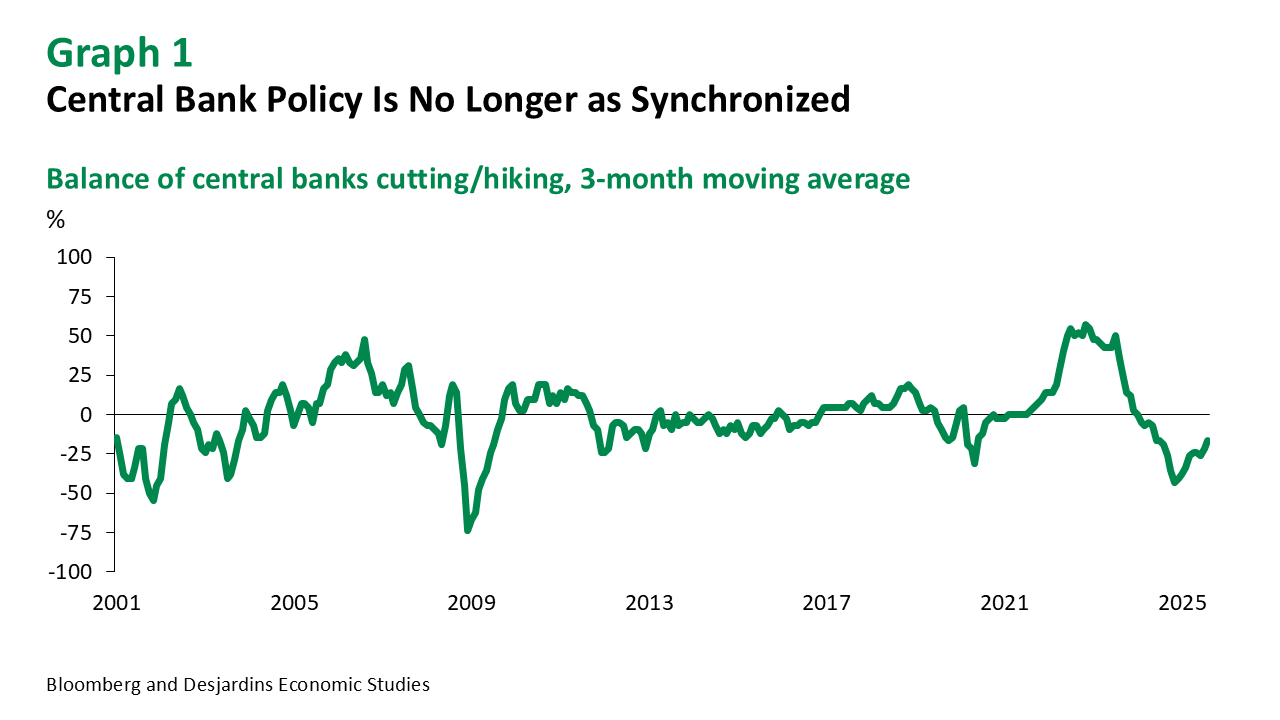
Central banks—once broadly synchronized in their tightening cycles—are now diverging, reflecting not only past policy decisions, but also idiosyncratic risks unique to the structure of each economy (Graph 1). The recent term‑premium‑led rise in global long‑term interest rates has blunted the impact of earlier rate cuts, keeping the bias toward further easing intact, even as policy makers tread cautiously. In the UK, central bankers are tapering their quantitative tightening (QT) program in the belief that, in today’s fragile environment, QT may exacerbate changes in long‑term interest rates. Monetary policy has never operated in a vacuum, but its tools are now increasingly ill‑suited to the complex mix of fiscal pressures, geopolitical instability and turbulent trade dynamics. Canada is a clear example of how global and domestic constraints and timing challenges are shaping monetary policy decisions.
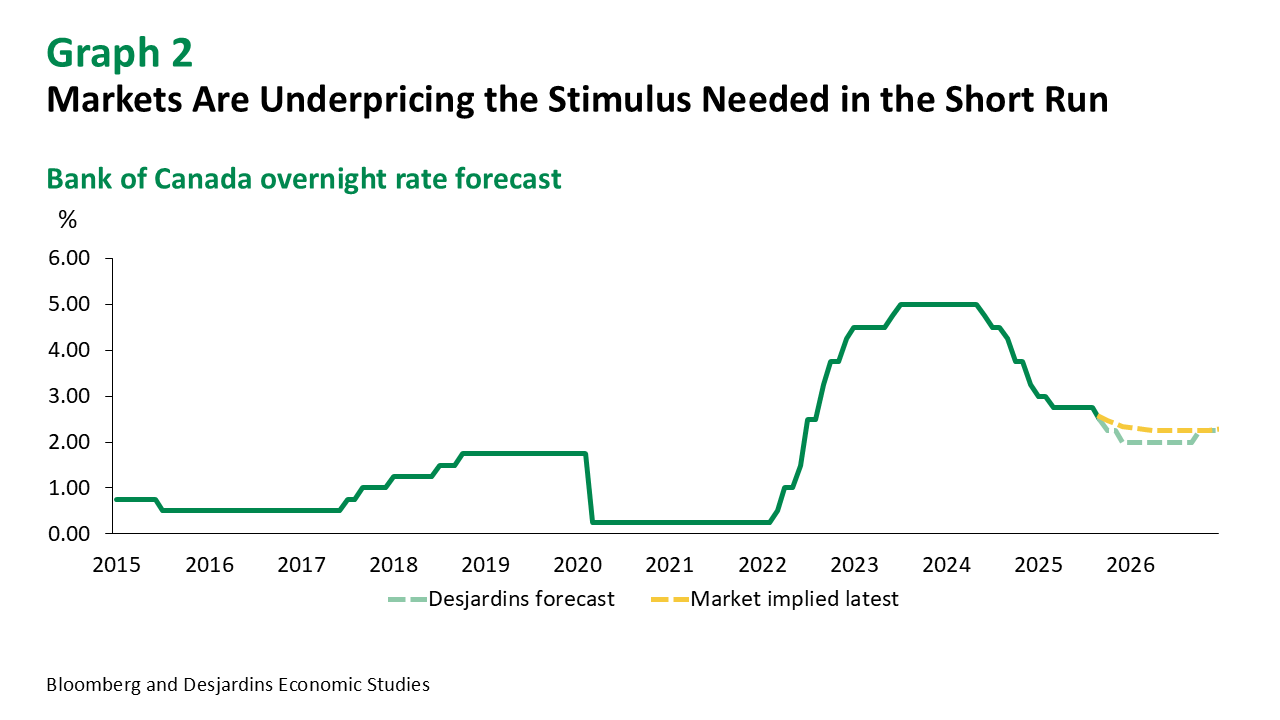
After remaining on the sidelines all summer, the Bank of Canada restarted its easing cycle in September.
The removal of countertariffs on US goods and continued normalization of core inflation were key to the decision to lower policy rates, giving policymakers the flexibility to shift their focus onto weaker economic activity. While fiscal policy remains supportive, investment in defence and infrastructure will likely arrive too late to meaningfully offset near‑term softness. With policy lags and legislative timelines in mind, the Bank likely reached the same conclusion we did, that further easing was the more immediate and flexible lever to stabilize growth. Given persistent underlying weakness in the economy, we continue to see room for interest rates to move lower and expect the policy rate to trough at 2.00% (Graph 2). The timing of incoming fiscal stimulus will be key in determining the future path for interest rates.
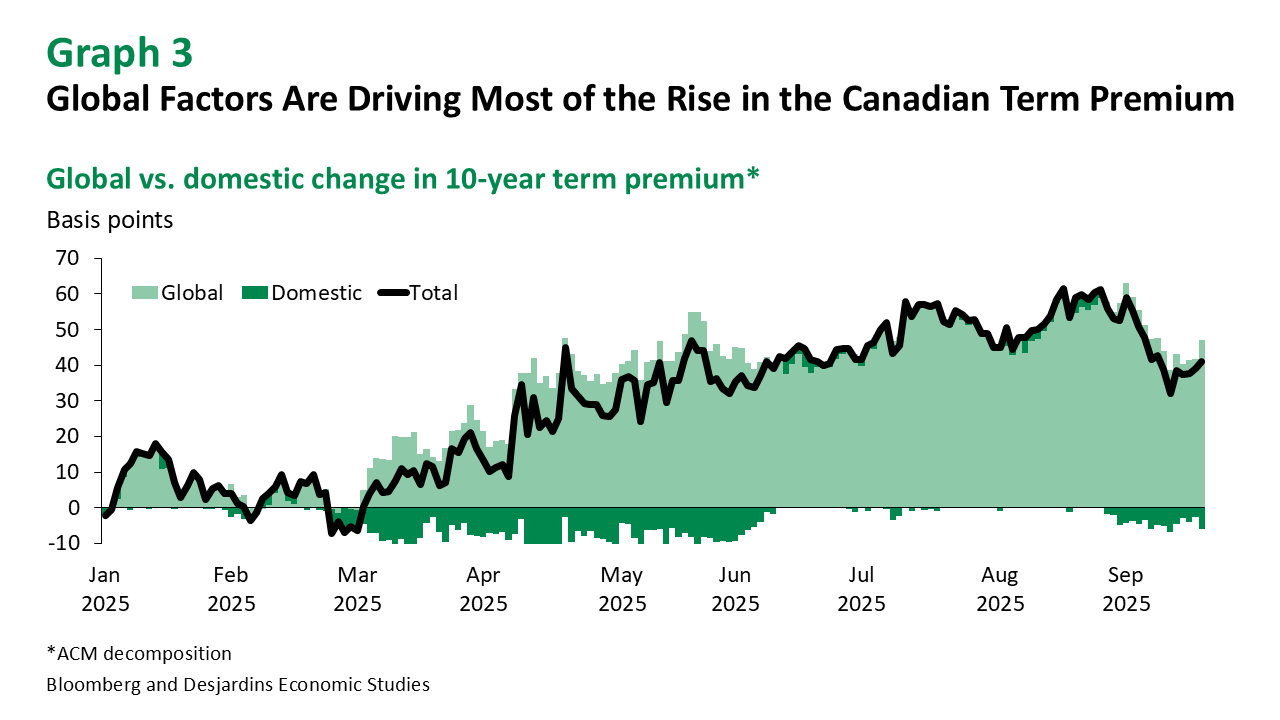
Canadian fiscal policy remains in the limelight, with markets anticipating a substantial upward revision to deficit projections in the upcoming federal budget.
These expectations reflect legitimate concerns around slowing growth and expanding defence spending. Keep in mind that Canada also entered this period from an enviable starting point relative to its global peers, with general government budget balances as a share of GDP still well‑contained. The rise in Canadian long‑term interest rates this year has been driven almost entirely by global factors, not domestic fiscal dynamics (Graph 3). Delivering a responsible budget this fall could maintain that narrative, allowing domestic fundamentals to exert even more downward pressure on long‑term yields and support outperformance in Canadian duration.
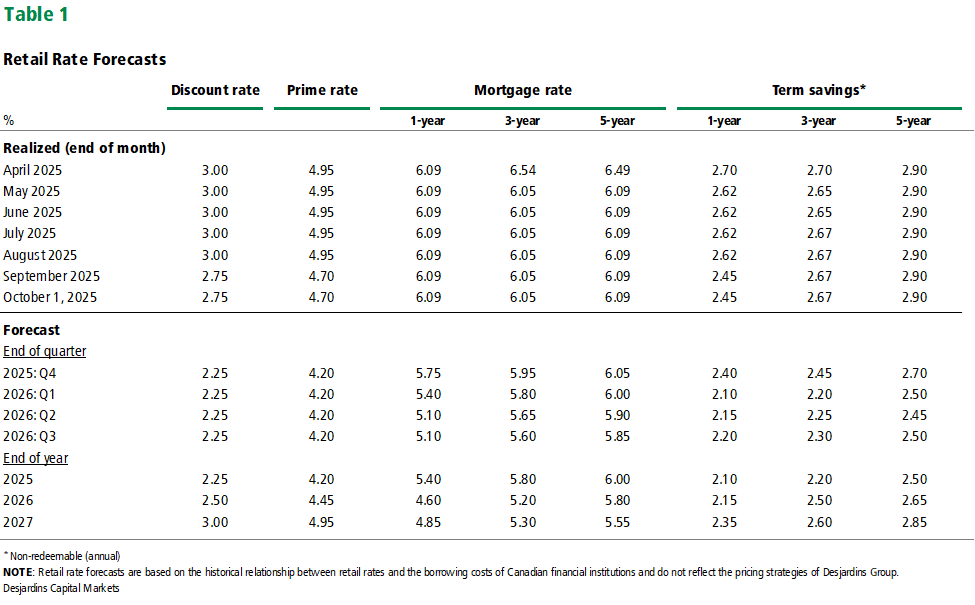
While mortgage rates remain elevated, they may gradually move lower if the Bank of Canada eases policy further and domestic factors weigh on term premiums embedded in benchmark yields.
This view is broadly consistent with our previous publication, and our outlook for mortgage rates remains unchanged. Housing activity continues to show signs of weakness, though headline figures mask significant variation across regional markets. Even though prices continue to fall in some of the major Canadian housing markets, activity is accelerating from a low base. Mortgage originations have picked up and are now consistent with levels seen in 2015–2016, with borrowers increasingly opting for shorter 3–4‑year fixed terms and variable rate mortgages, reflecting expectations for further monetary easing. We expect this preference for shorter terms to persist going forward.
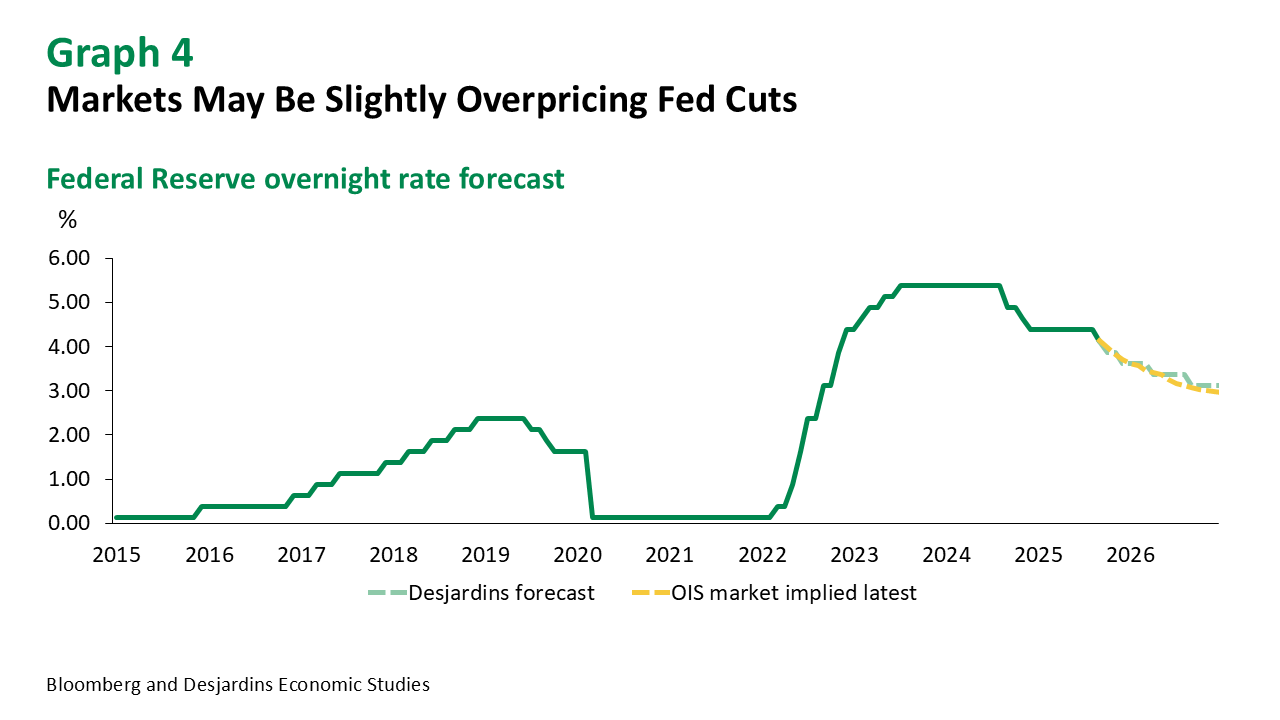
Across the border, the Federal Reserve also resumed its easing cycle in September, driven by mounting evidence of labour market weakness.
While headline job growth has slowed, preliminary benchmark revisions suggest the starting point for employment was already softer than previously thought, reinforcing the case for rate cuts. Importantly, the inflationary impact of tariffs has remained relatively contained, at least so far. Our rate cut expectations are in line with markets, however, we expect the policy rate to remain above 3.00% in the second half of 2026 and into 2027 (Graph 4). Our forecast assumes that more tariff‑induced inflation will show up south of the border in the months to come.
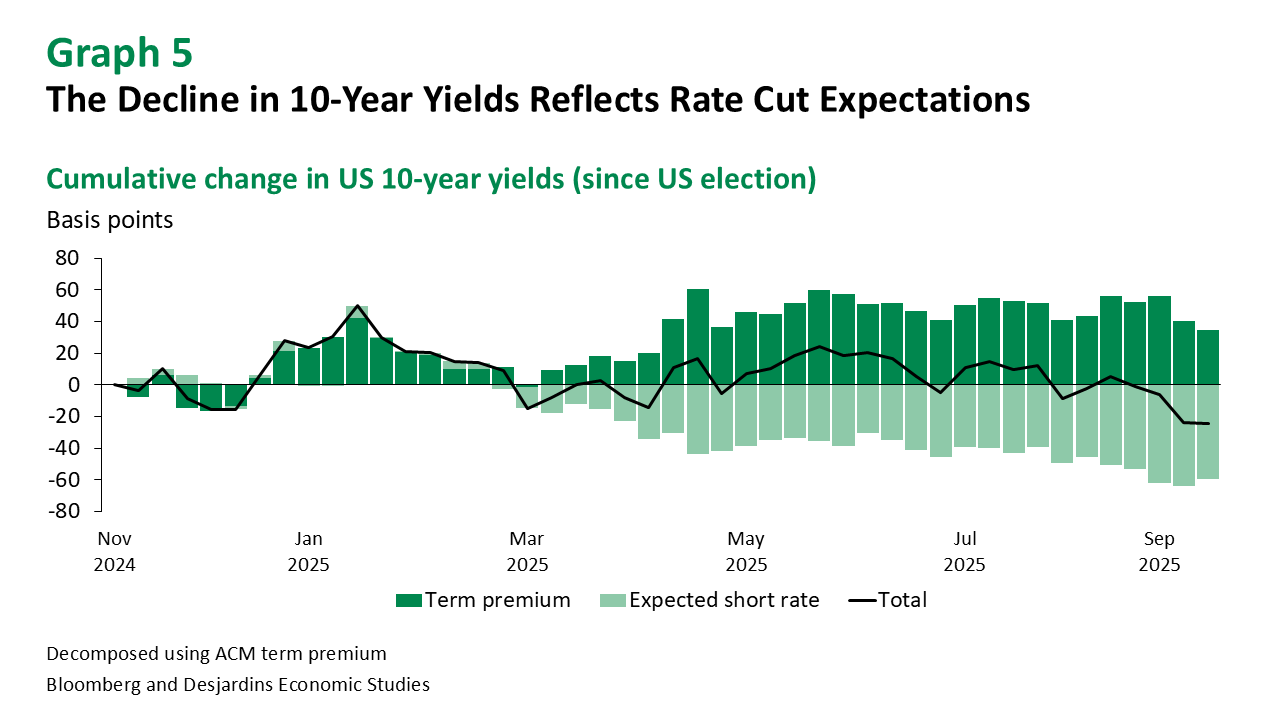
Beyond the near‑term policy outlook, institutional uncertainty is also shaping market dynamics.
The recent rally in the long end of the US yield curve has been driven by falling policy rate expectations, not a normalization in the term premium (Graph 5). That premium remains elevated, reflecting persistent uncertainty around institutional risks and the broader macro backdrop. Speculation continues around Fed Governor Lisa Cook’s future, and questions are mounting over whether Jerome Powell will stay on as a Governor after his term as Chair is up. As 2026 approaches, concerns over Fed independence are likely to intensify. These risks—while not yet fully priced in—could keep term premiums sticky, even as the Fed eases further, arguing for a steeper curve.
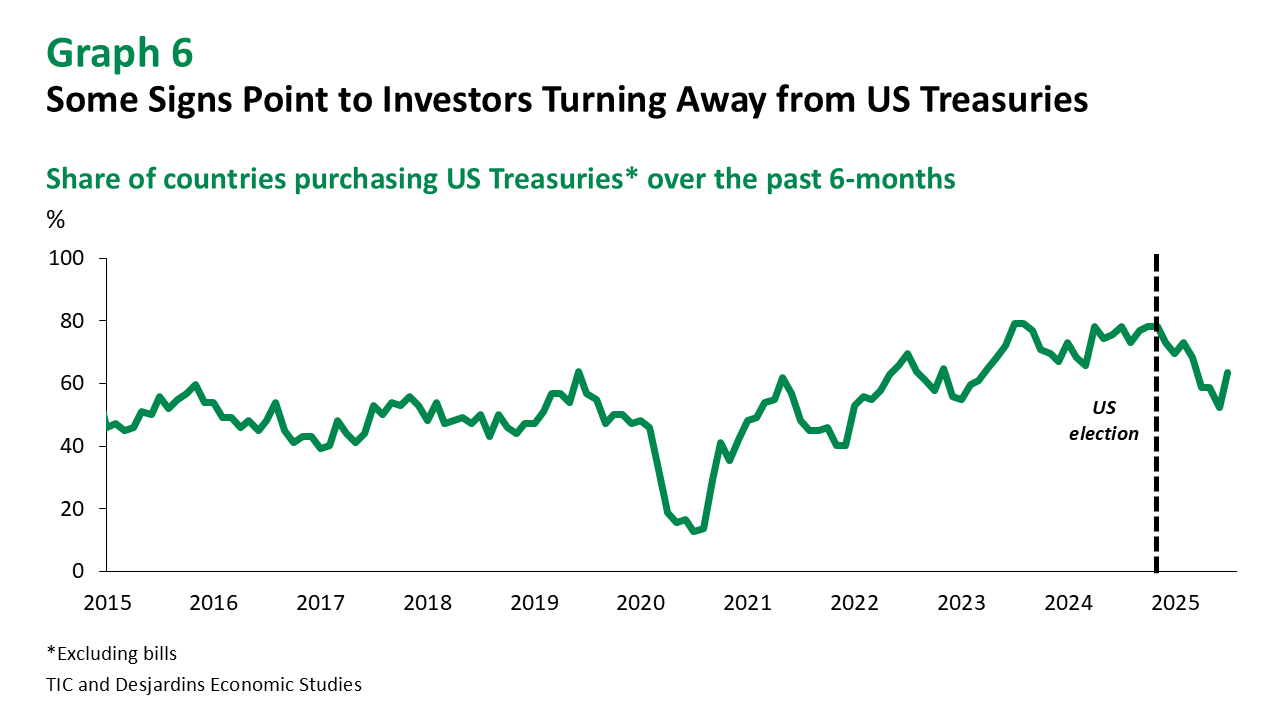
These institutional uncertainties are shaping foreign demand for US Treasuries.
While headline figures show limited evidence of a broad‑based retreat by foreign investors, a closer look reveals a more nuanced picture. The share of countries actively purchasing Treasuries has slowed significantly since the US election, suggesting growing caution (Graph 6). Canada has benefited from this. Since the US election, US long‑duration funds have seen outflows while Canadian funds have seen strong inflows.
Exchange Rates
The broad US dollar continues to weaken as markets price in a greater number of rate cuts from the Federal Reserve.
Some of that weakness reflects concerns that a politically influenced Fed may front-load easing ahead of the 2026 election. While the longer‑term outlook for the dollar remains pessimistic, there’s a risk of a reversal heading into year‑end. Growth outside the US remains sluggish, and it may not take much for the US to outperform.
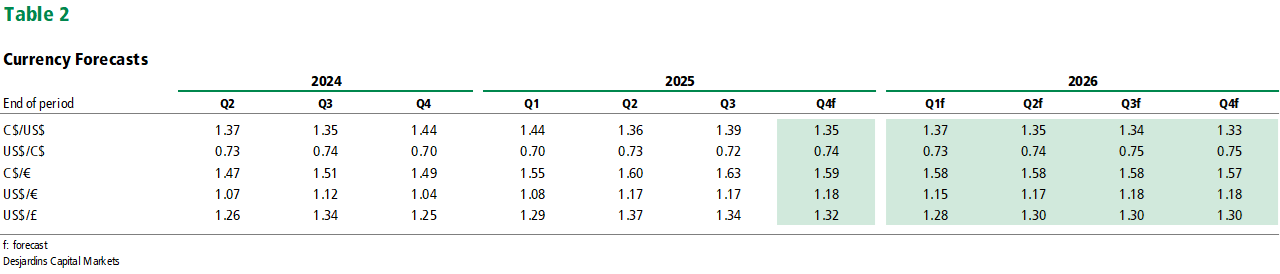
We now see less upside for the Canadian dollar over the next year.
With pension fund hedging largely in the rearview mirror, interest rate differentials are likely to become a more dominant driver of FX movements. Uncertainty remains around which central bank—the Bank of Canada or the Fed—will ultimately ease more relative to current market pricing. We continue to see more scope for the Bank of Canada to sustain its dovish stance, while the Fed may be less inclined to ease if inflation accelerates. Both should limit upside in the loonie. We’re maintaining our year‑end USDCAD forecast at 1.35 but have revised our 2026 target higher to 1.33.
Equities and Credit
Equity markets have notched all‑time highs amid an eerie calm, juxtaposing the chaotic policy backdrop.
Realized volatility across jurisdictions—particularly in the US—has fallen to historically low levels. Part of this reflects falling discount rates, which have provided a tailwind to valuations as markets price in what feels like the maximum amount of easing possible absent a recession.
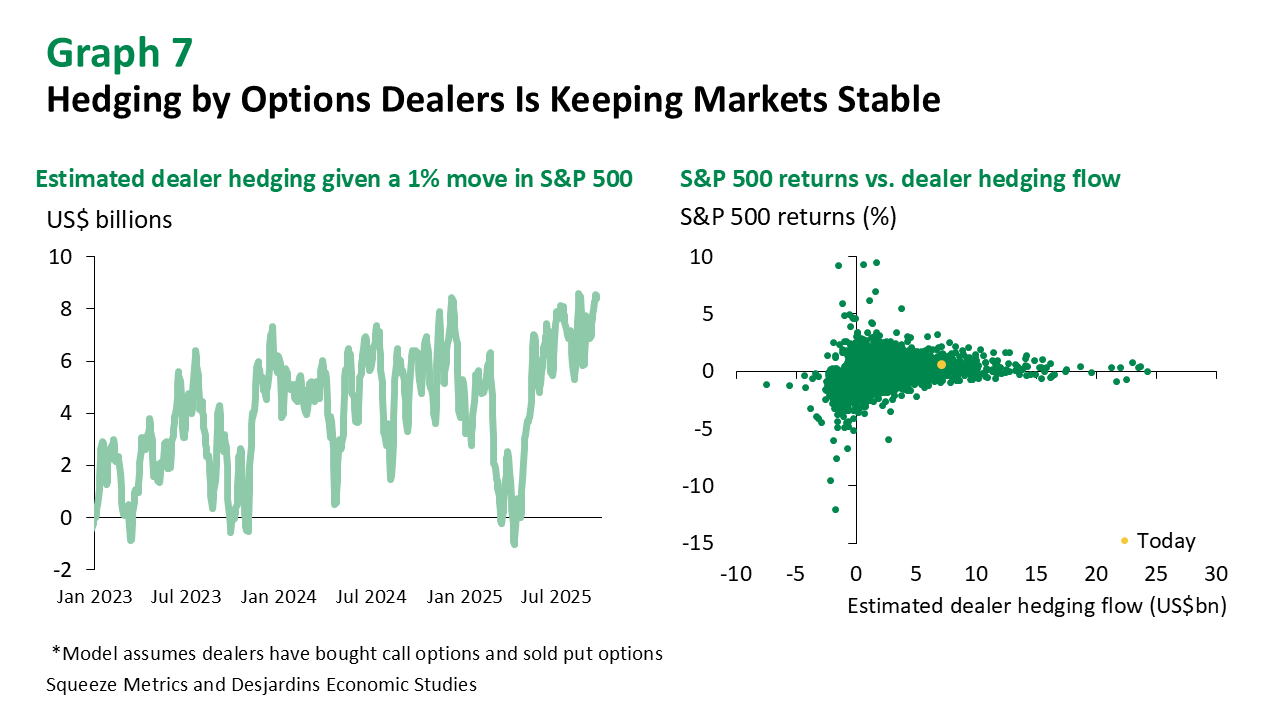
Beyond optimism around rate cuts, structural forces are helping suppress equity market volatility.
A key driver is the rapid growth of income‑generating investment products that use options strategies, which are often designed for retirees seeking alternatives to traditional fixed income. These products have ballooned from about US$100 billion in 2020 to over US$275 billion. Because these strategies rely on options, dealers who facilitate them must hedge their exposure, and those hedging flows tend to smooth out market movements. In fact, the amount dealers need to hedge for a given move in the S&P 500 is now close to the highest level seen since the pandemic (Graph 7, Left). This creates a “pinning” effect, where equity markets are less likely to move sharply in either direction, even in response to new information (Graph 7, Right).
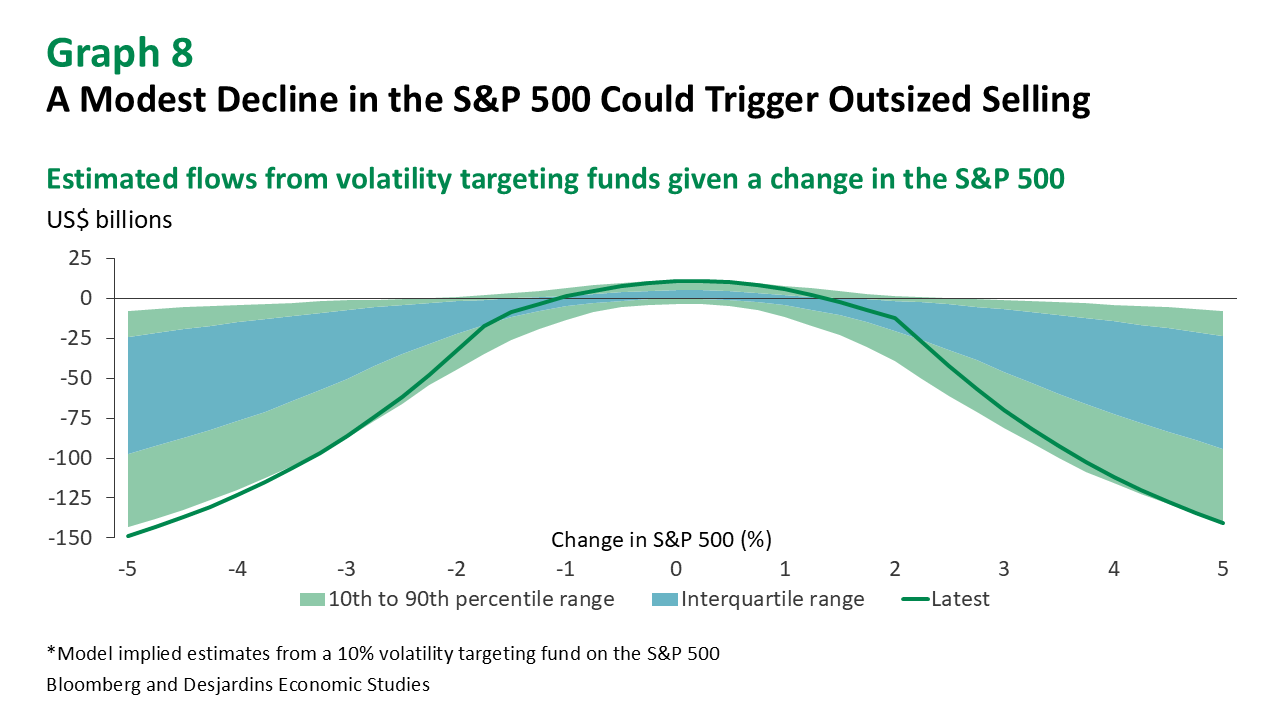
This dampened volatility has knock‑on effects for systematic investor positioning.
Volatility targeting funds, risk parity strategies, and commodity trading advisors (CTAs) tend to maintain large equity allocations in low‑volatility environments. Crucially, their sensitivity to market moves is also elevated, meaning even modest drawdowns can trigger outsized selling. Our estimates suggest a 3% decline in the S&P 500 could prompt up to US$100 billion in selling from volatility targeting funds alone, marking one of the highest sensitivity levels observed in the post‑COVID era (Graph 8).
Strong revenue and earnings beats, a deregulation agenda, tailwinds from capex spending, lower policy rates and incoming fiscal stimulus all support a positive outlook for equities. Moreover, resilient corporate margins, improving productivity trends, and the potential for AI‑driven efficiencies continue to underpin investor optimism. Stretched valuations and stagflation risks do create a more ominous backdrop with the potential for sudden bouts of volatility but are unlikely to stop equities from moving higher.
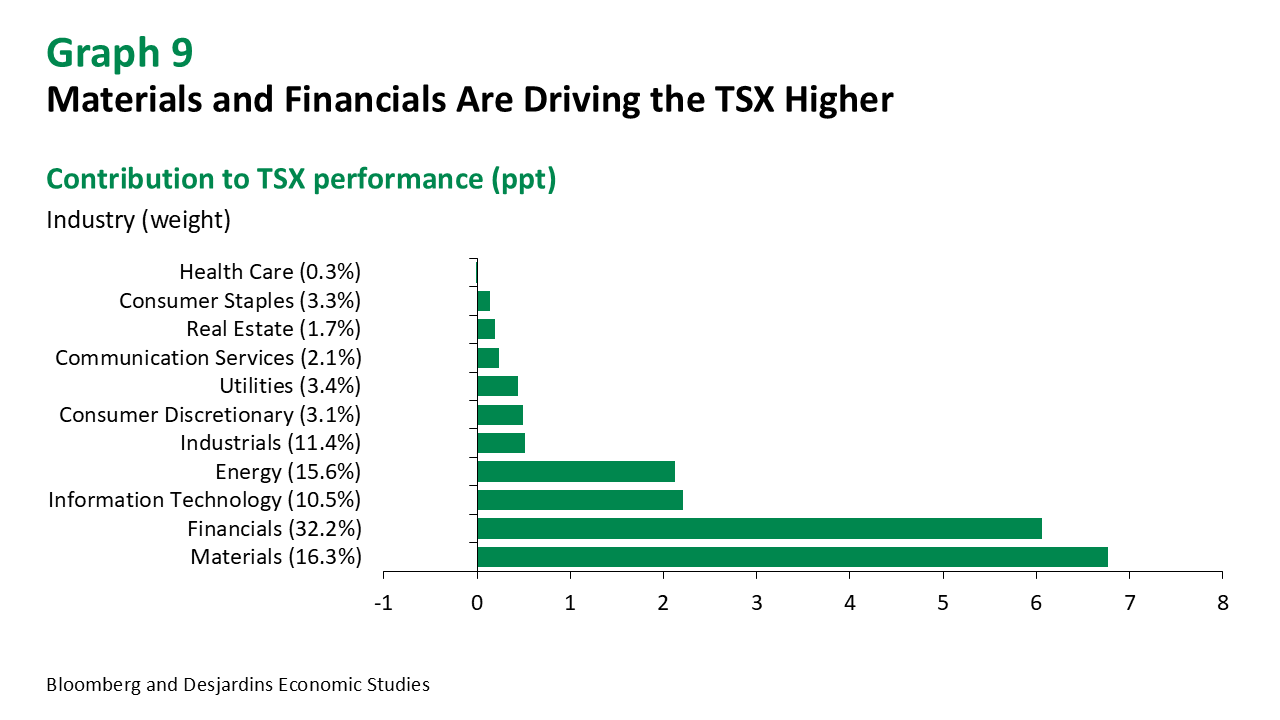
Canadian equities have emerged as big winners.
The TSX has effectively served as a hedge against institutional fragility, moving in tandem with global gold prices as investors seek protection from potential U.S. dollar debasement. The materials sector—which accounts for just 16% of the broader index—has driven nearly a third of the year‑to‑date returns, outpacing financials despite the latter carrying more than double the weight (Graph 9). In an environment where institutional risks and macro volatility remain elevated, this linkage to hard assets has become a key differentiator for Canadian equities, even though the strength has extended beyond commodities.
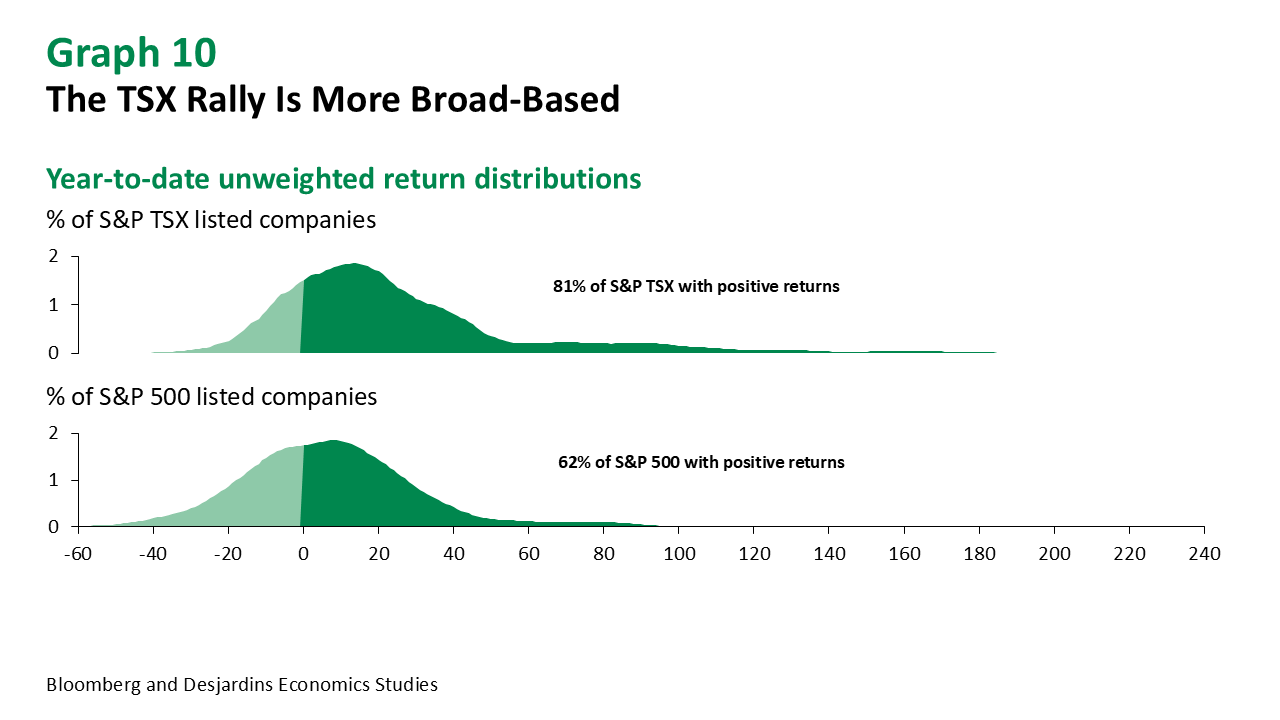
Not only has the TSX outperformed, but the rally has also been far more broad‑based.
Equal‑weighted return distributions show that roughly 80% of TSX constituents have posted positive returns this year (Graph 10), in stark contrast to the S&P 500, where gains remain concentrated in the Magnificent Seven. That concentration—alongside underperformance in broader US equities—may be one reason why investors have increasingly turned to Canadian equities, which offer both diversification and more balanced sector participation.
We continue to expect the TSX to outperform the S&P 500 both this year and next.
The drivers of Canadian equity returns have been more diversified, with continued tailwinds from commodity‑linked sectors and a stabilizing outlook for financials as the mortgage renewal cycle passes. While the opportunity cost of underweighting US equities has historically been high, the outperformance of global markets this year—and the rising concentration risk within the S&P 500—should support a broader reallocation away from American stocks, and in part toward Canadian equities. This shift could have knock‑on effects for valuations, where we expect US multiples to compress modestly over the coming year, while Canadian equities benefit from capital inflows.