- Jimmy Jean, Vice-President, Chief Economist and Strategist
Tiago Figueiredo, Macro Strategist • Oskar Stone, Analyst
Investment Strategy and Interest Rate Analysis
Liberation Day Unlikely to Bring Clarity
March 28, 2025
Economic Trends and Interest Rates
The global economy remains mired in uncertainty, which is unlikely to be resolved quickly
The US administration’s trade policy is fracturing long-standing relationships with global peers and dismantling institutional norms that underpin and guarantee the safety and territorial integrity of many countries. Such dramatic shifts do not come without consequences. Business and consumer sentiment is deteriorating, particularly in countries more directly impacted by these trade policies. Investment and spending plans are being sidelined as businesses await clarity. Ambiguity around the US’s willingness to uphold its presumed role in global defence is leading to increased military and infrastructure spending worldwide. Ultimately, the continued weaponization of uncertainty is likely to push most developed market economies into or close to a recession in the coming year.
European rearmament is lifting sentiment in the region
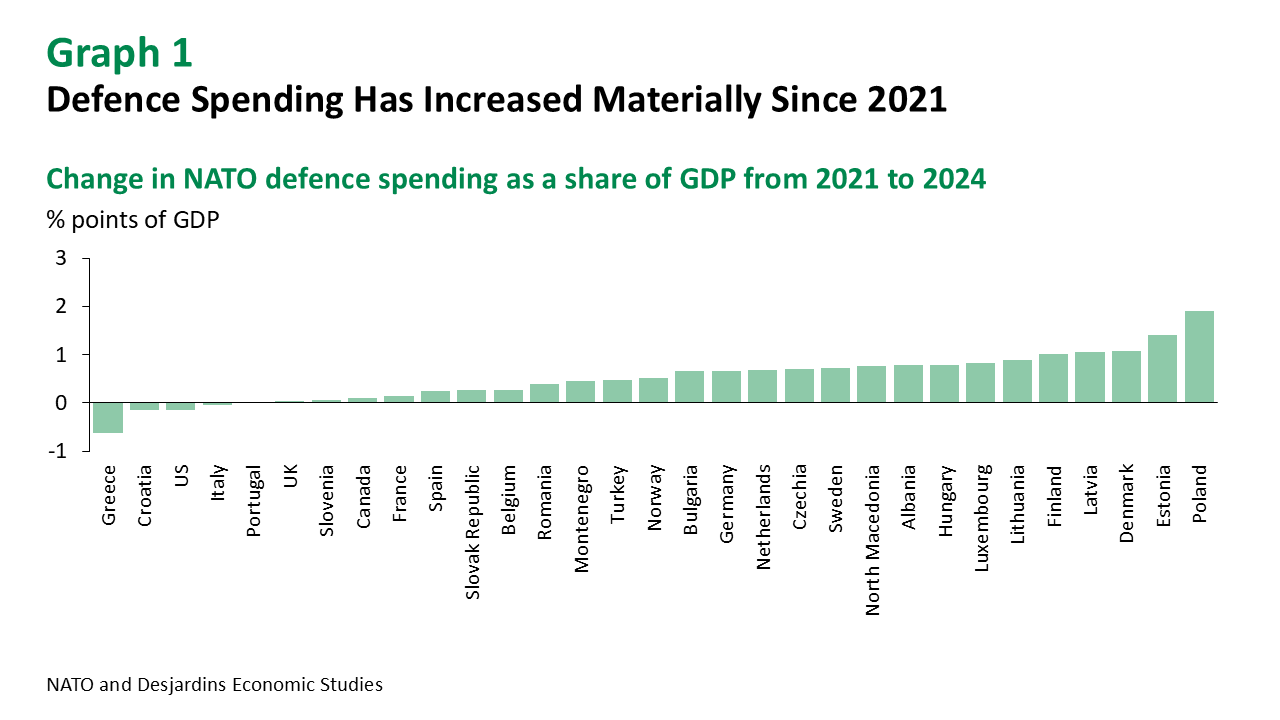
European assets are rallying on the prospect of peace in Ukraine as officials inch closer to a ceasefire agreement. However, any ceasefire agreement is likely to leave something to be desired, as Ukrainian NATO membership is not on the table. The US’s threats to renege on NATO commitments are being taken seriously by the European Commission, which has increased defence spending limits by up to €500 billion. Additionally, the new German government has approved €500 billion for infrastructure and defence spending over 12 years. This increase comes alongside a broader rise in military spending from NATO members following Russia’s invasion of Ukraine in 2022 (graph 1).
European fiscal measures have not significantly shifted growth expectations
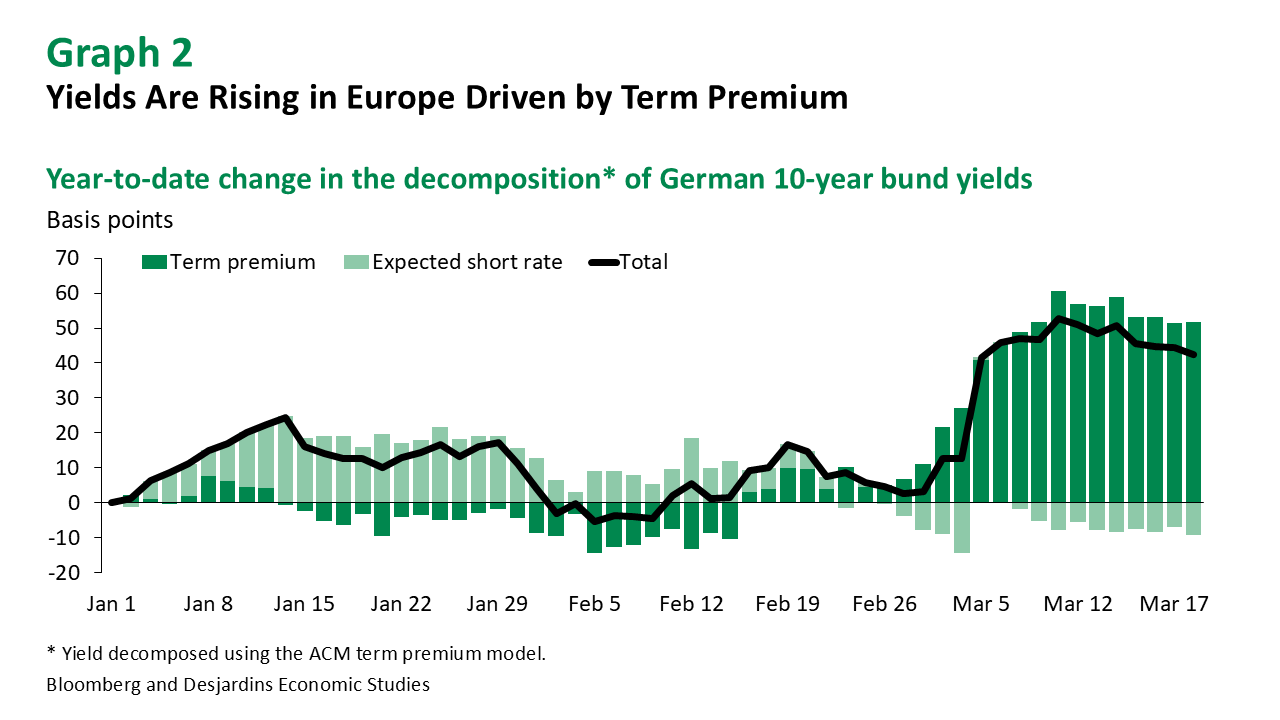
While infrastructure spending has clear long-term benefits, the impact of defence spending is less clear, with uncertainty continuing to weigh on activity in the region. The ECB will adjust its forecasts once detailed spending plans are released, but for now, central bankers believe policy is meaningfully less restrictive. We anticipate two rate cuts from the ECB this year, with risks skewed towards an even slower pace of easing. Most of the increase in German bund yields is due to rising term premiums rather than higher policy rate expectations, suggesting some tightening of financial conditions in the bloc is not tied to domestic growth and inflation prospects (graph 2).
A trade war with the US poses a significant challenge to Canada’s economy
Our new forecasts predict a recession in Canada, with growth heavily impacted by trade measures. However, concerns about inflation are likely to prevent interest rates from falling as much as they typically have during past recessions. The uncertainty surrounding the duration and impact of tariffs on inflation makes the path for overnight interest rates highly unpredictable, and Canadian central bankers are focusing on risk management to avoid policy missteps. With rising inflation expectations a particular concern, policymakers are likely to favour a pause in April to wait for more clarity. This approach could, however, result in a faster cutting cycle if growth risks materialize faster.
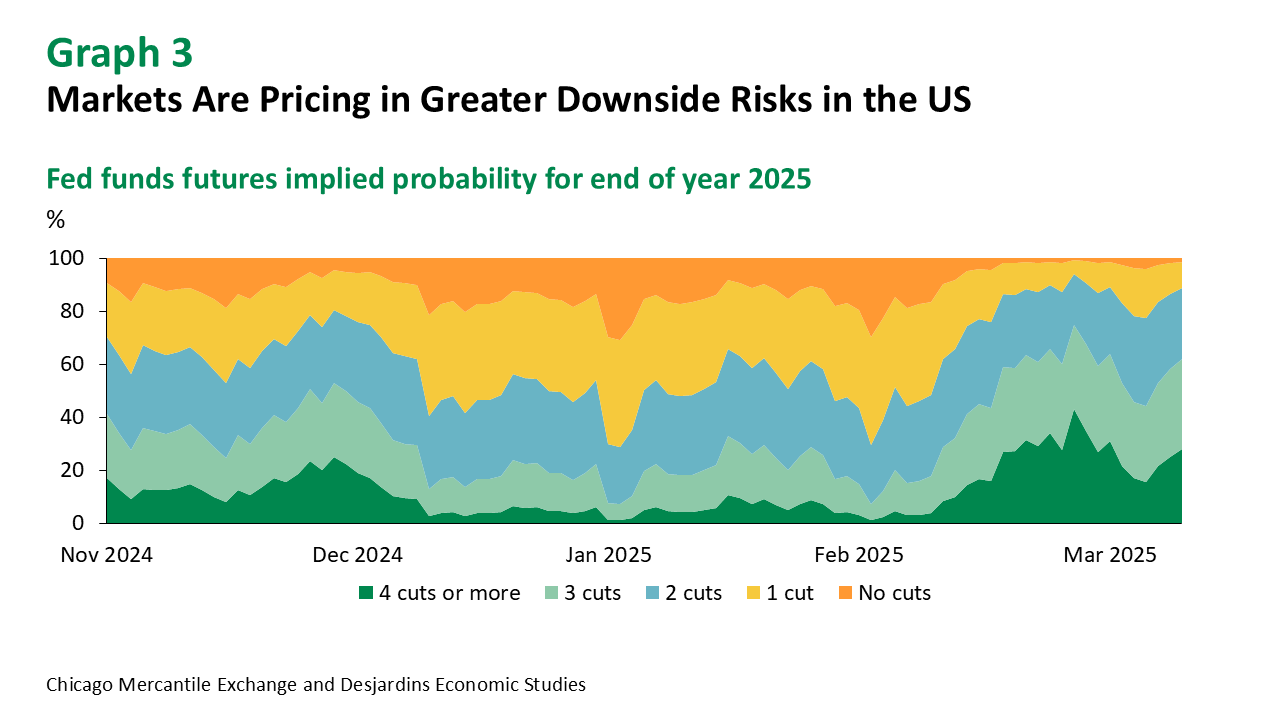
The market has turned less rosy on the US economy
The US administration’s protectionist policies are likely to weigh on economic activity at a time when growth was showing signs of slowing (graph 3). The additional drag from these incoming policies could push the US into a recession, with our economics team projecting two consecutive quarters of negative growth in the middle of the year. Stalled progress on inflation coupled with a sharp rise in inflation expectations across some measures should see a limited policy response from the Federal Reserve. While Chairman Powell has downplayed the recent rise in inflation expectations, if this move persists or broadens across a range of indicators, it will be challenging for the Fed to maintain the view that inflation remains on a path towards the 2% target. Our revised forecasts now see the Federal Reserve cutting rates three times this year, with risks balanced around that projection.
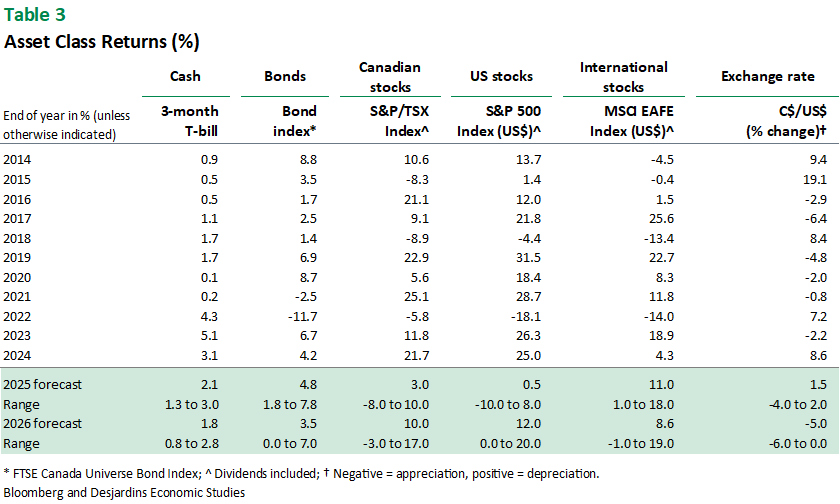
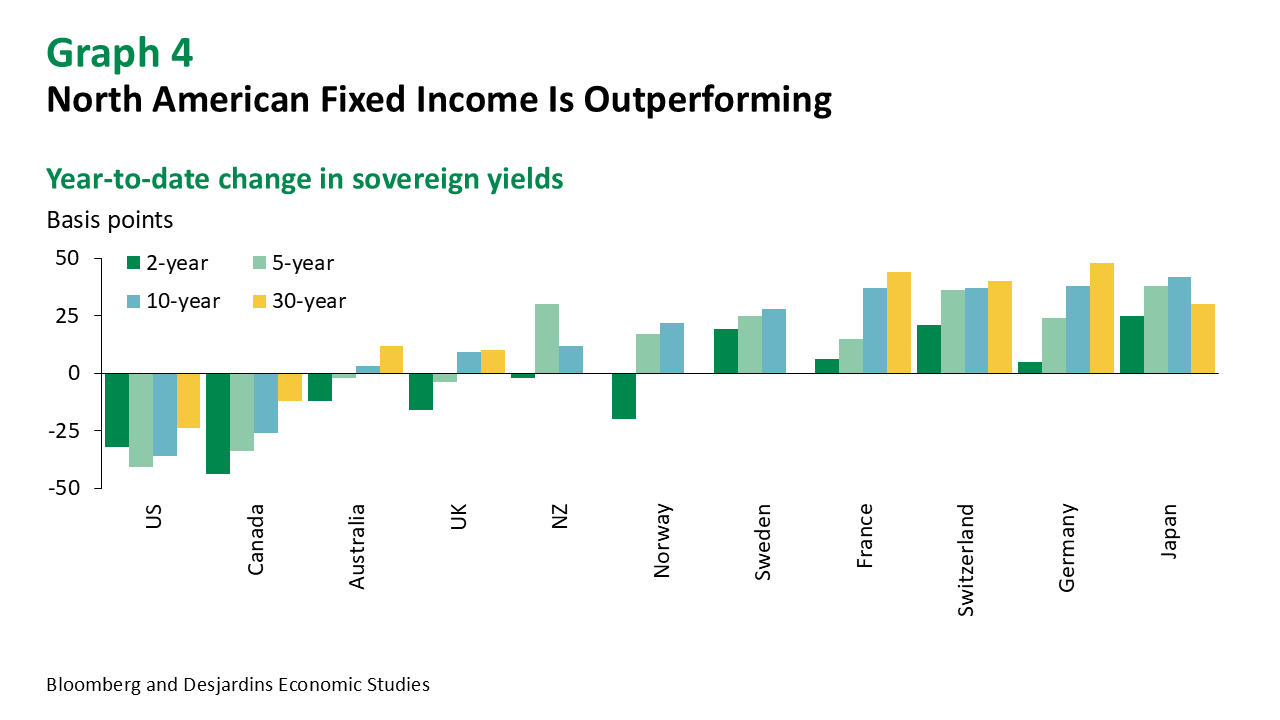
Against this backdrop, North American fixed income should outperform (graph 4)
While in the near term the Bank of Canada is likely to deliver a more hawkish tone to protect against a further increase in inflation expectations, we believe the central bank will ultimately need to cut its policy rate by another 100 basis points this year. As such, the Canadian yield curve is at risk of flattening in the first half of the year before continuing to steepen in the second half. In the US, Treasury yields are likely to move lower in the coming months as economic activity slows. As a result, interest rate differentials between the US and Canada should start to converge this year. European fixed income has been under pressure as the market continues to digest the implications of the landmark shift in government spending. The effects of that spending on growth and inflation are still unclear, and we have less conviction on European fixed income as a result.
The Bloomberg Commodity Index has risen over 5% year to date
The index has been primarily led by strength in precious metals and soft commodities, but nearly all subcategories are positive on the year. The end of the ceasefire in the Middle East has once again raised concerns of a further broadening of the conflict, although risks of such escalation seem more contained relative to last year.
Exchange Rates
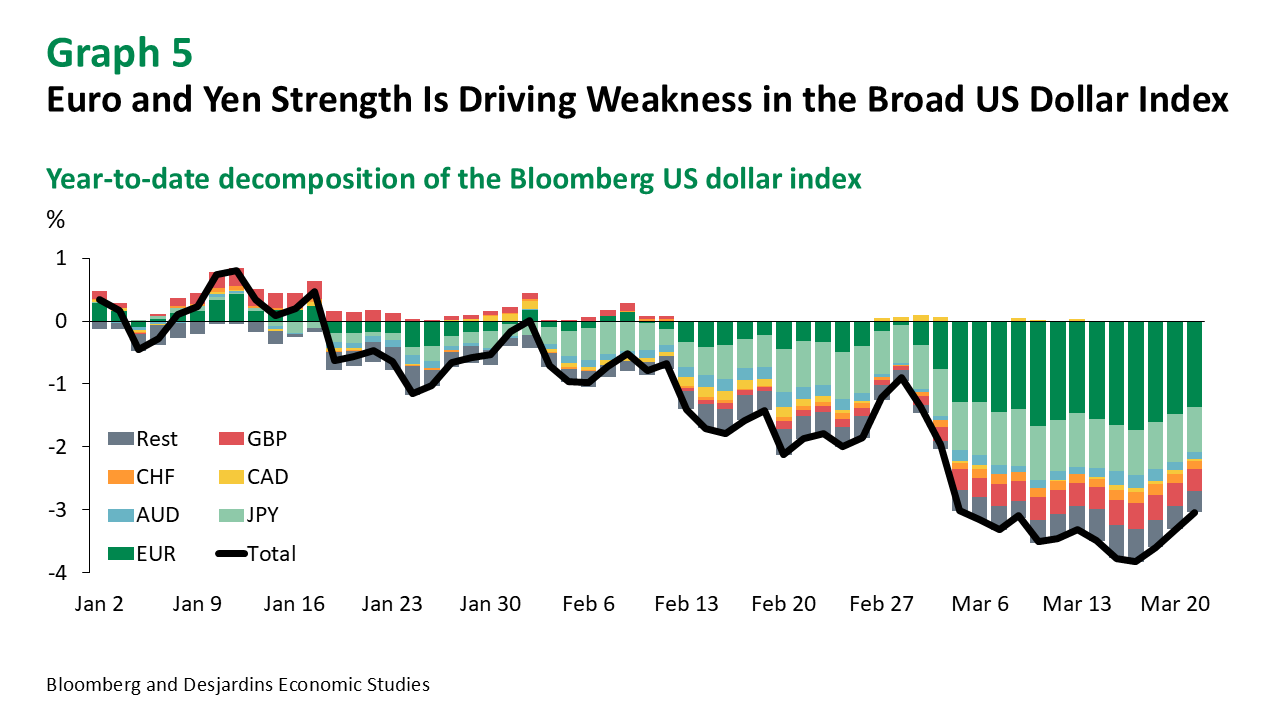
The broad US dollar index has fallen 2% over the past month
Most of that weakness has come from strength in the euro as European assets trade on fiscal policy developments (graph 5). Hawkishness from the Bank of Japan has also put upward pressure on the yen, weighing on the US dollar. Overall, positioning in US dollars has unwound somewhat with investors showing the smallest net longs since the US election.
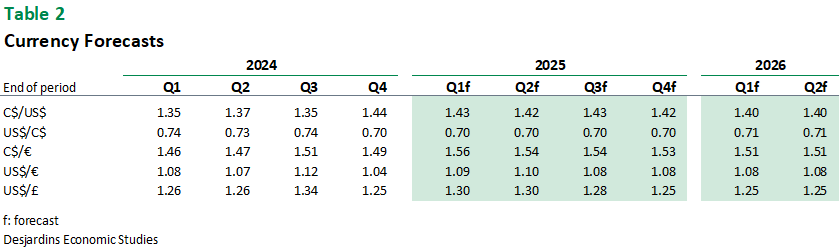
The Canadian dollar has traded in a tight range recently but is the worst performing currency against the greenback this year
While the latter shouldn’t come as a surprise given Canada has taken the brunt of the tariff news this year, the former likely reflects the market’s belief that tariff measures are temporary. But there is a risk that could change. Overall, risks around the Canadian dollar are more balanced today with the worst likely over. Potential weakness in the US economy will offset some of the risks of a further depreciation by increasing the odds of lower rates stateside. The next key event will be the implementation of reciprocal tariffs on April 2, which the US administration has already begun to water down.
Equities and Credit
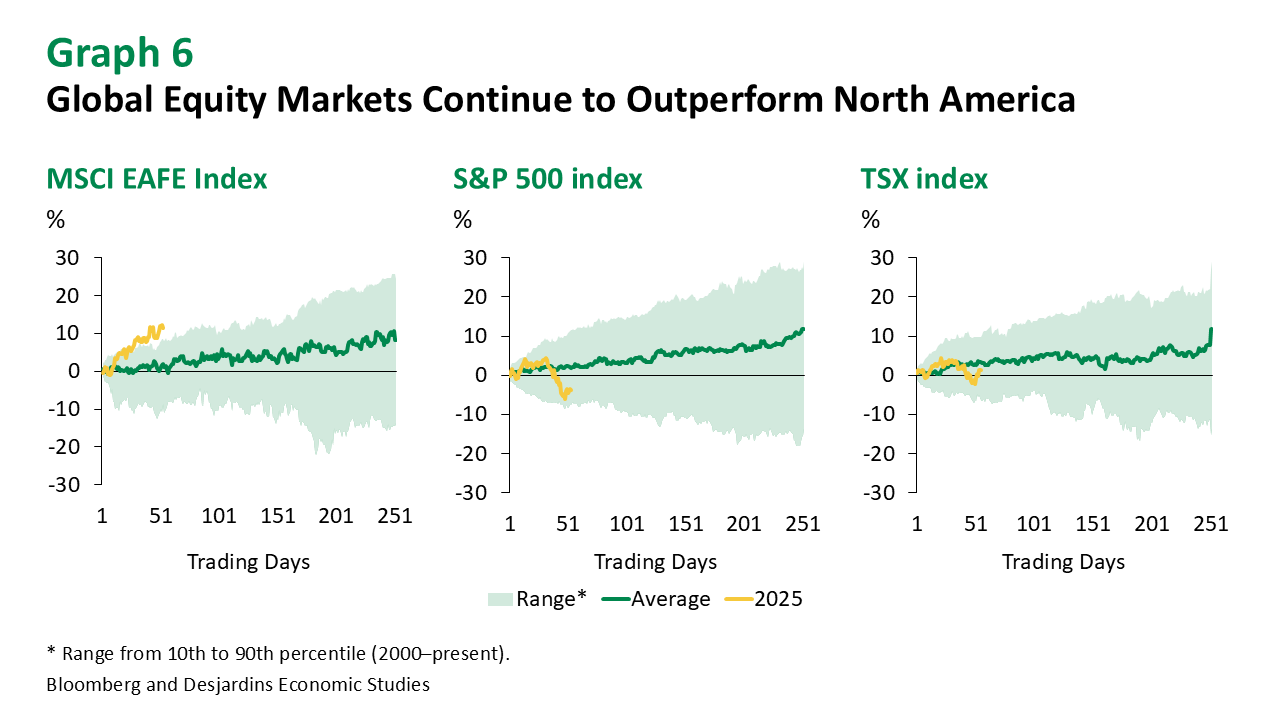
There are a myriad of concerns weighing on global equity markets, most of which are originating stateside
US trade policy and the drag from tariffs on earnings has seen the most limelight. Still, some fear that US technology stocks could experience a dot-com-style unwind, while others fret that the hundreds of billions in US AI-related capital expenditure may be wasted. Then there’s the spectre of a softer US labour market as a byproduct of the ripple effects from DOGE’s (Department of Government Efficiency) cost-cutting measures. All of the above has further exacerbated the outperformance of global equity markets as investors look for exposure in more positive themes like global AI and the European fiscal shift (graph 6).
In the latest vintage of the Bank of America’s Global Fund Manager Survey, there was a record reversal away from US equities in March. Indeed, regional diversification benefits have been very large this year, with average correlations across global developed equity markets falling to the lowest levels since the early 1990s.
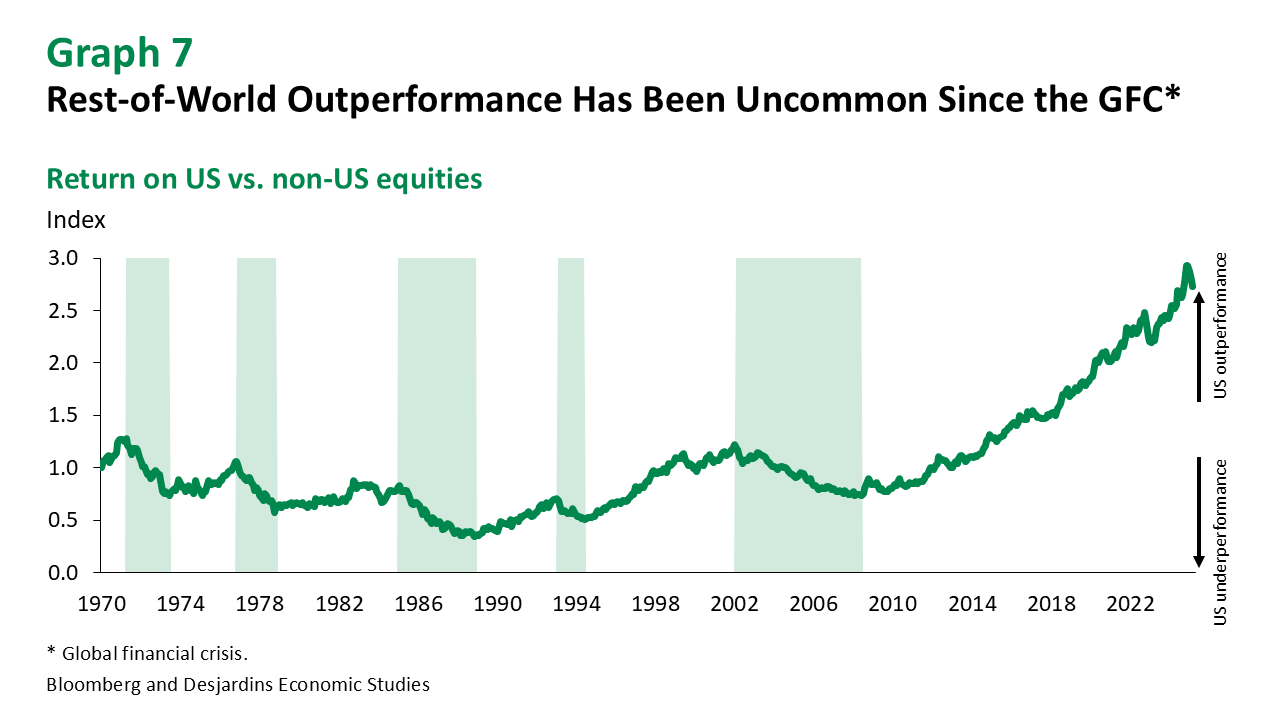
Over the past 15 years, US equities have consistently outperformed the MSCI World Excluding United States Index (graph 7)
Relatively weaker economic growth outcomes in Europe along with the rise of the US technology giants explain a large portion of this. While we see rest-of-world outperformance in the near term, it’s too early to come to any conclusion on a sustained shift toward global equities at this juncture.
Our equity forecasts have been revised lower to reflect the weaker economic backdrop
Rest-of-world equities are now expected to outperform this year relative to North American counterparts. Much of that comes from the fact that the US and Canada are in a trade war that will likely push both economies into a recession. A mild recession typically sees equities bottom out in the early stages of the downturn and hit average drawdown of 25%. As such, equities are likely to drift lower over the next two quarters before rebounding towards the end of the year. Our forecast is highly conditional on a continuation of current trade policy. On that, US officials have publicly accepted an “adjustment phase” for the US economy, indicating a higher threshold for pain in financial markets. Canadian equities have outperformed relative to the US, and we expect that to continue throughout the year.
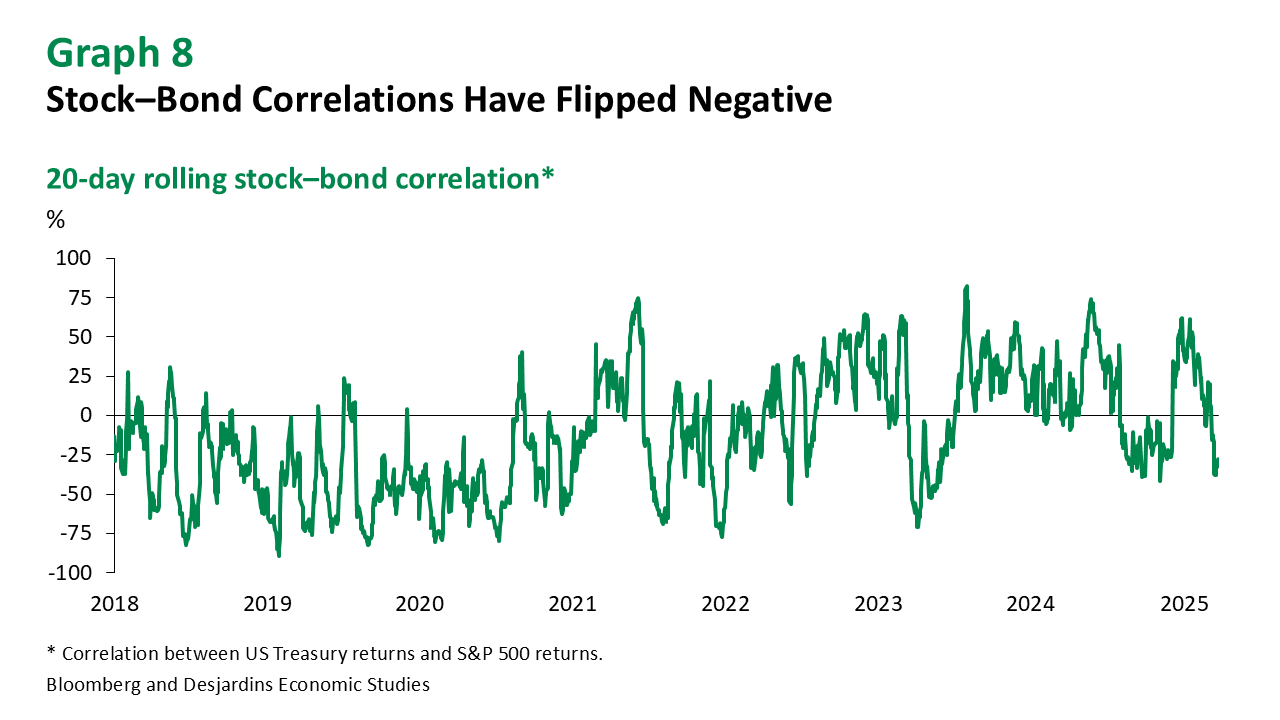
Bonds have helped cushion losses in equity portfolios (graph 8)
The market has interpreted the incoming shock as primarily a growth shock. We agree with that interpretation, but there is an inflation component as well that could push stock–bond correlations positive. While that’s a lower probability event, for that scenario to play out, inflation expectations would need to show signs of becoming unmoored, essentially turning a tariff problem into an inflation problem.
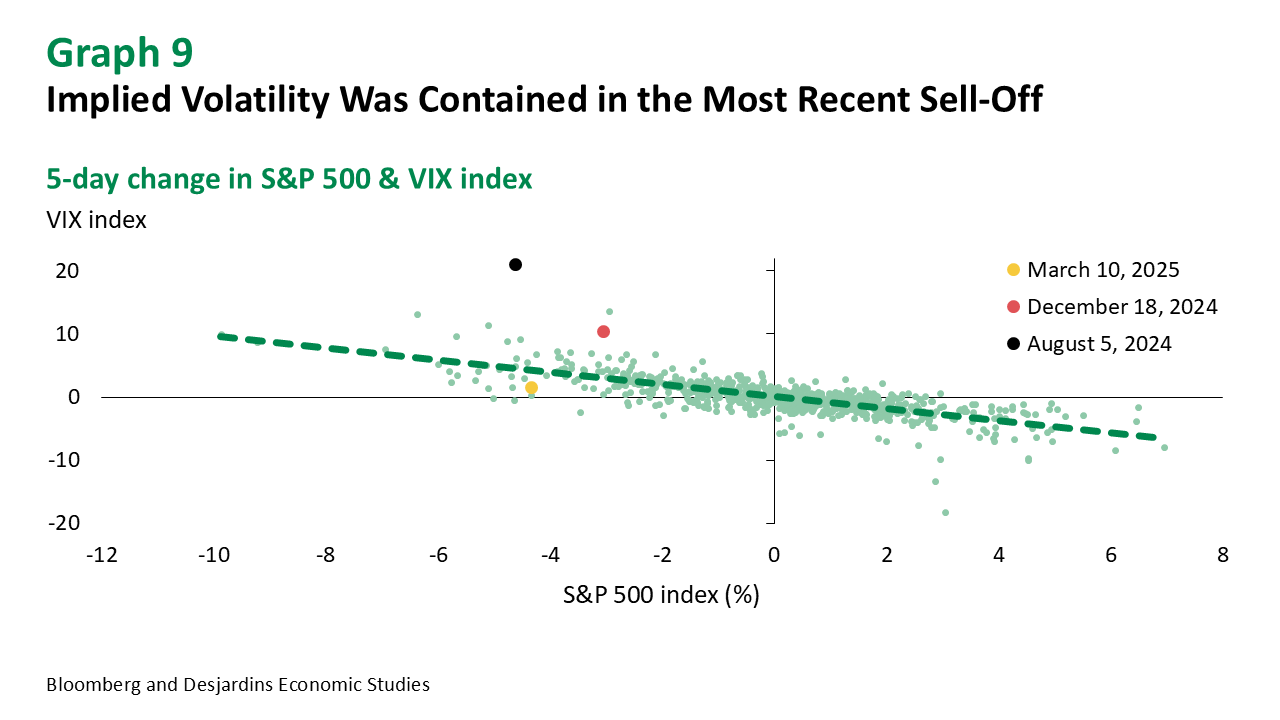
Volatility markets took the recent price action in stride
Following the post-pandemic inflation episode, many cross-asset investors have been more actively hedging their equity exposures with VIX-related products given the instability in stock–bond correlations. In the past, this shift has created stress in volatility markets when changes in the VIX index were outsized given the move in the underlying equity (graph 9). Those stresses didn’t emerge in the recent sell-off, in part because volatility had reset higher, making those alternatives more expensive. Stock–bond correlations remained negative, helping with some of the hedging burden, but in a scenario where correlations flip positive, reliance on these alternative hedges will increase and could create some market stability issues.
Corporate spreads have widened but remain very low historically
Investment-grade (IG) spreads in North America are at levels comparable to the lows seen in 2019. Meanwhile, high-yield (HY) spreads continue to trade through levels seen pre-pandemic. The rising interest rate environment has forced corporate issuers to reduce overall duration. In Canada, the duration on the corporate bond index is now close to 6 years, down from over 7 years during the height of the pandemic. Overall activity remains strong, with IG issuance tracking roughly in line with 2024 levels. However, HY issuers are borrowing less cash, with issuance in sector roughly 20% short of last year’s levels.