- Jimmy Jean, Vice-President, Chief Economist and Strategist
Tiago Figueiredo, Macro Strategist • Oskar Stone, Analyst
Investment Strategy and Interest Rate Analysis
Markets Shrug in the Wake of Geopolitical Escalations
June 30, 2025
Economic Trends and Interest Rates
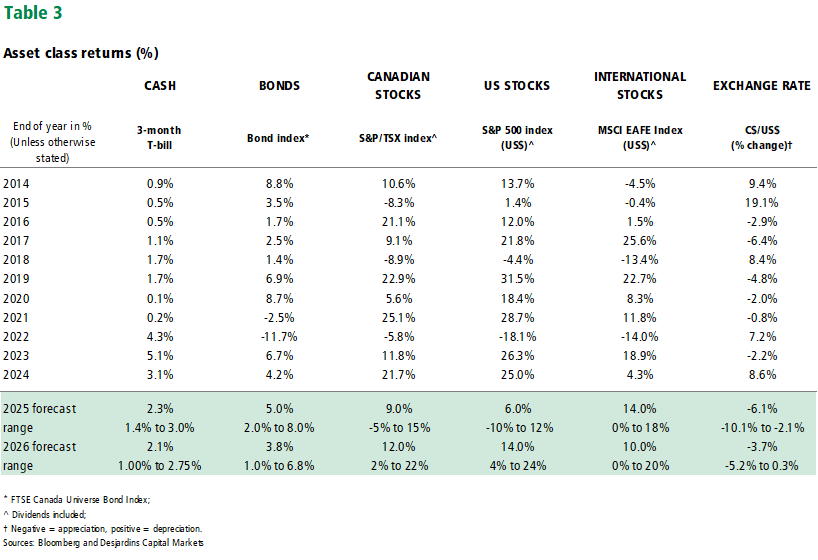
Global financial markets shrugged off two weeks of missile exchanges between Iran and Israel.
This escalation was met with unremarkable moves in fixed income markets as yields across jurisdictions remained within recent ranges (Graph 1). Similarly, equity markets are still near all-time highs and oil prices, although higher, are well off the recent peaks. The nonchalant reaction in markets partly reflects a perceived lack of retaliatory options from Iranian officials. While the flow of oil out of the Middle East may still be disrupted, markets seemingly believe that any moves of this sort would likely be temporary given the wide‑reaching implications for Europe and Asia. Higher oil prices may rekindle some inflationary pressure near‑term, but the risk of a protracted period of high inflation remains low in the minds of global investors.
As such, the direction of travel for policy rates and, by extension yields, remains lower.
Most central banks adjusted policy as expected since our May update. The biggest surprise come from the Norges Bank, which cut its policy rate for the first time this cycle. The Swiss National Bank also cut its policy rate to zero and markets are pricing a potential return to negative policy rates by year‑end. Interestingly, the market cap of negative yielding debt has started to rise after being essentially zero for most of 2024. While that increase is negligible relative to the US$18T peak seen in late 2020, it is an indicator worth watching going forward. The pace of easing will vary by jurisdiction, but we broadly expect policy rates to be lower across most jurisdictions by this time next year.
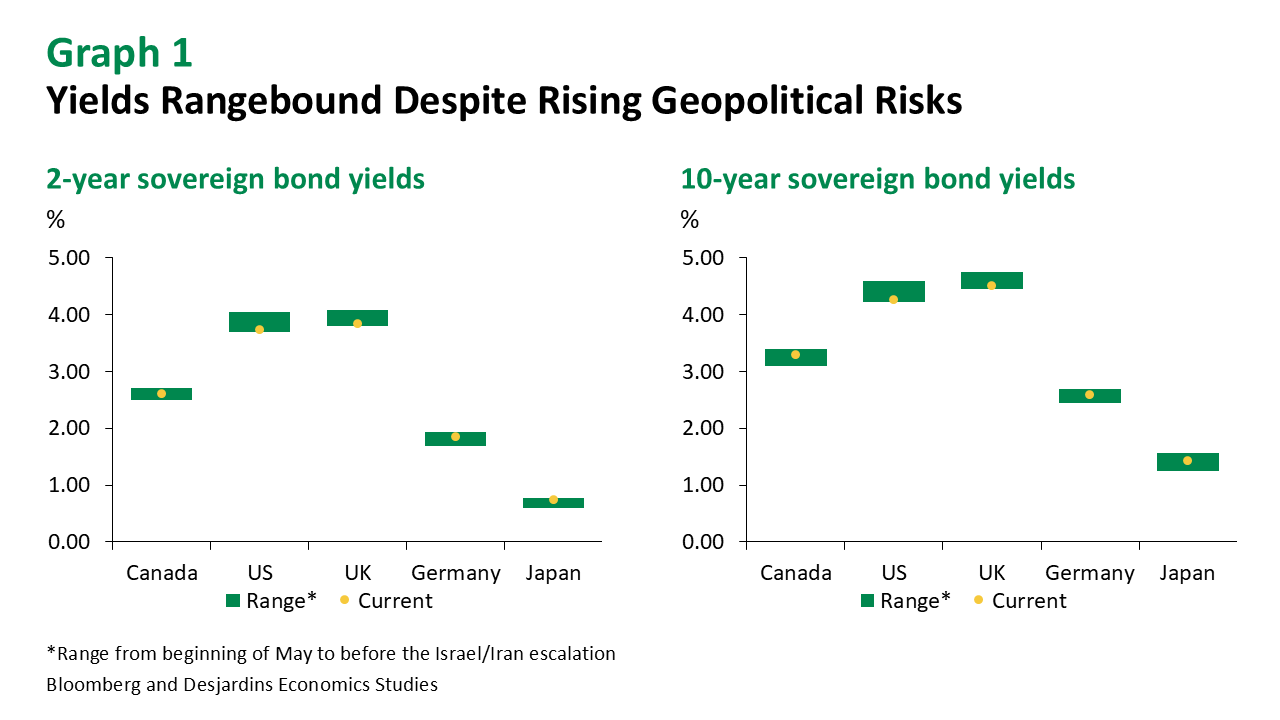
The Bank of Canada is no exception, and we expect three more rate cuts this year.
After easing the overnight rate by 225 basis points over the past year, Canadian central bankers do have the flexibility to wait. Particularly in an environment where a potential trade deal could be struck soon. Q1 inflation expectations were firmer than expected and the Bank’s own core inflation metrics are still hovering around 3% on an annual basis (Graph 2). Policymakers will need to see progress on their core inflation metrics before recommencing their easing cycle. The good news is that there was evidence of such cooling in the May CPI release for those who looked closely. Positive developments on trade and the potential for more infrastructure and defence spending are supporting the Canadian economic outlook, but there is still scope for more monetary easing due to headwinds relating to the weak housing market, slowing population growth and the ongoing mortgage renewal cycle.
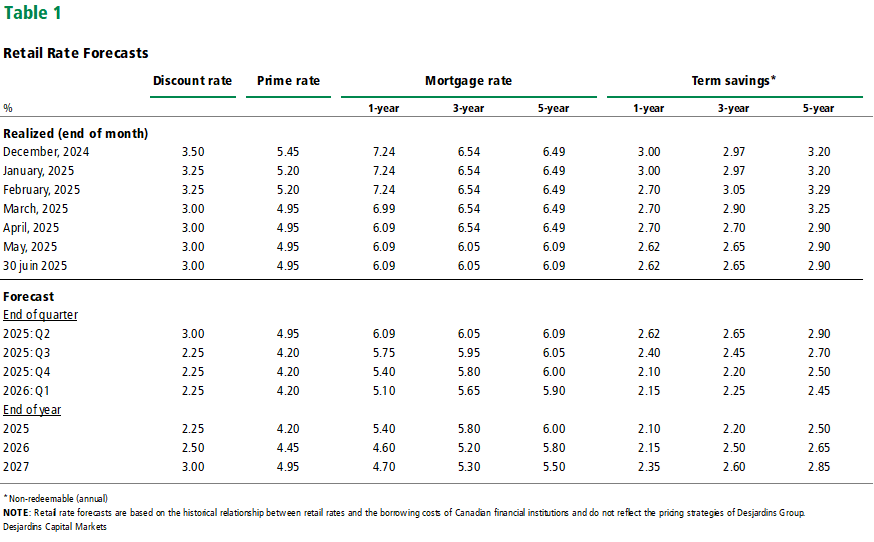
Our forecasts for Canadian mortgage and term deposit rates are little changed from the last update.
Near-term adjustments reflect a marking‑to‑market of our forecasts following the Bank of Canada’s pause in June. We continue to expect a gradual decline in mortgage rates over the coming years.
In the US, an improved outlook means that rate cuts may come sooner rather than later.
Progress on trade with China has materially reduced the risk of tariff‑related inflationary pressures. The Fed has also digested three consecutive benign CPI prints with limited evidence of tariff‑related impacts. The message from Fed Chair Powell remains one of patience. Recession risks are still elevated but not our base case, and there’s certainly no rush to cut policy rates. However, more and more Fed officials have been opening the door to a possible rate cut in July. While we view this as unlikely, we continue to see three rate cuts from the FOMC this year, with the first cut more likely to come in September.
A myriad of factors have pushed global term premiums lower throughout June.
The initial surge in term premium earlier this year came from news on European fiscal spending and fears of a buyers’ strike on US fixed income. While the latter proved to be overblown, the latest developments on the former suggest that spending in Germany could be more front‑loaded. While we still believe that there are upside risks to term premium, the speed of the moves year‑to‑date should lead to some consolidation throughout the summer.
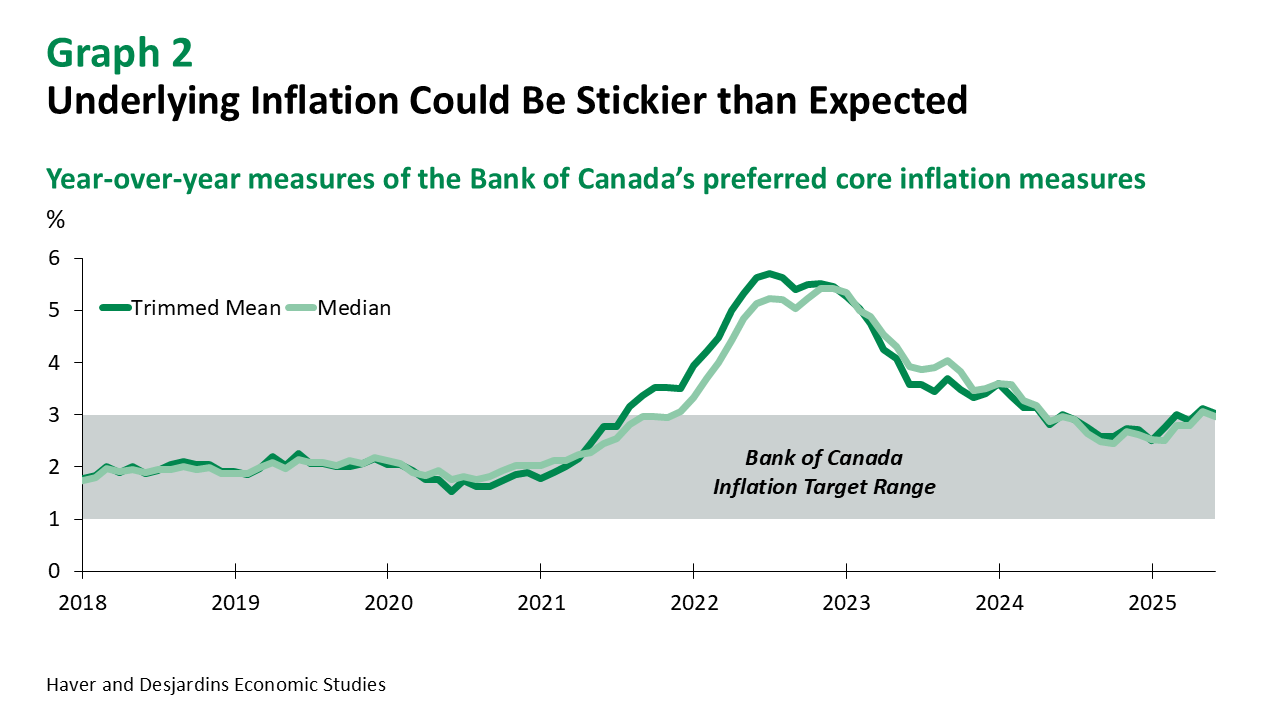
Canadian term premium has not followed global trends, but fears of a lack of demand are inflated.
A potential front-loading of spending on defence and infrastructure has raised concerns around the market’s ability to digest incoming supply (Graph 3, Left). We think these fears are overblown. Canada is in a much better fiscal position than many of its peers (Graph 3, Right). Still, the Canadian long-end has underperformed relative to the US over the past month and that could continue given the absence of a federal budget.
We continue to expect yield curves to steepen into year-end.
The front‑end should lead the steepening, and that steepening is expected to be much more pronounced in Canada relative to the US. Still curves are not expected to steepen as much as what is typically seen during rate cutting cycles as Canada is expected to skirt a recession.
Changes to the supplementary leverage ratio (SLR) could reduce volatility in US Treasuries (USTs).
The supplementary leverage ratio (SLR) is a rule that forces US banks to hold 3-5% of their total assets in Tier 1 capital. The calculation treats safer assets, like USTs, the same as riskier assets like junk bonds. Many US banks are currently constrained in their ability to intermediate fixed income markets due to this ratio. With Treasury supply continuing to increase, and market participants leery to hold US duration, the need for dealers to warehouse duration risk is rising. Changes to the SLR would help address these issues and should lower volatility, particularly during periods of stress.
Cross-border security purchases for April do not suggest a material rotation away from US assets.
April’s Canadian international securities transaction data showed an unwind of some of the large flows into and out of Canada in March. On net, there was limited evidence that investors were replacing US fixed income with Canadian bonds during the tumultuous month. That said, US data did suggest that Canadian investors were large sellers of US Treasuries over the month, although flows from Canada to US Treasuries have been volatile recently, making it difficult to draw any conclusions. The balance of payments data released in Europe revealed net buying of European government bonds, but flows were well within historical ranges. As a result, the available data do not indicate evidence of a significant shift in investor behaviour in April that clearly points at a sudden rotation away from US Treasuries into other government bonds. This is still in line with our view that any allocation away from the US will remain gradual and play out over a longer time horizon.
Exchange Rates
The USD regained its safe haven status…sort of.
Earlier in the year, it did appear that the US dollar had lost some of its safe haven status when faced with shocks related to the US economy and financial markets. However, recent developments in the Middle East showed that the greenback is still viewed as a safe asset during geopolitical shocks. The nuance is key and suggests that economic or financial shocks leave investors net sellers of US assets, while geopolitical shocks see investors as net buyers of US assets.
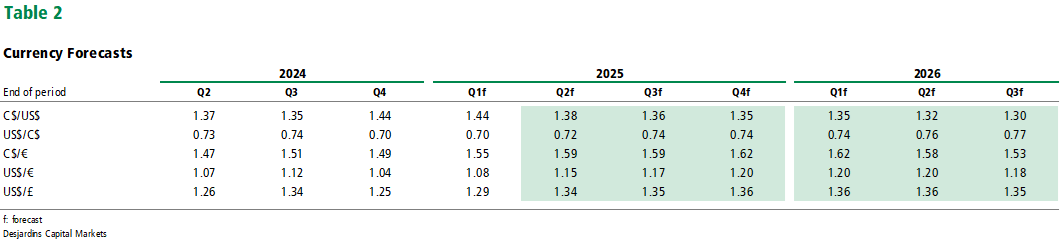
The Canadian dollar likely has more room to appreciate, and we continue to see USDCAD at 1.35 by year-end.
Most of that strength in the loonie should come from further weakness in the US dollar. In that respect, the strength in the CAD is likely to come later in the year once there is more clarity on geopolitical risks.
Equities and Credit
Ongoing uncertainty is expected to stall equity markets going into the summer.
The barrage of tariffs earlier in the year should start to weigh on economic activity and raise concerns about a sharper slowdown. Geopolitical uncertainty could also weigh on sentiment near‑term, although the transmission mechanism to corporate bottom lines in North America is less clear. While we expect these factors to keep equities rangebound, risks are skewed to the upside in the event the US economy remains strong and geopolitical risks subside.
We’ve revised our year-end targets higher across equities.
The upward revision reflects a continued de‑escalation of tariff policies. Earnings‑per‑share estimates are now higher and we no longer expect an earnings recession. The sectors that stand to benefit the most from potential upside revisions to EPS estimates are industrials and energy which had begun to price in weaker economic activity ahead of Liberation Day. While the deadline for renegotiating reciprocal tariffs looms, there doesn’t appear to be much appetite for a further ratcheting up of tariff rates from the US Administration.
European equities still at the mercy of fiscal policy.
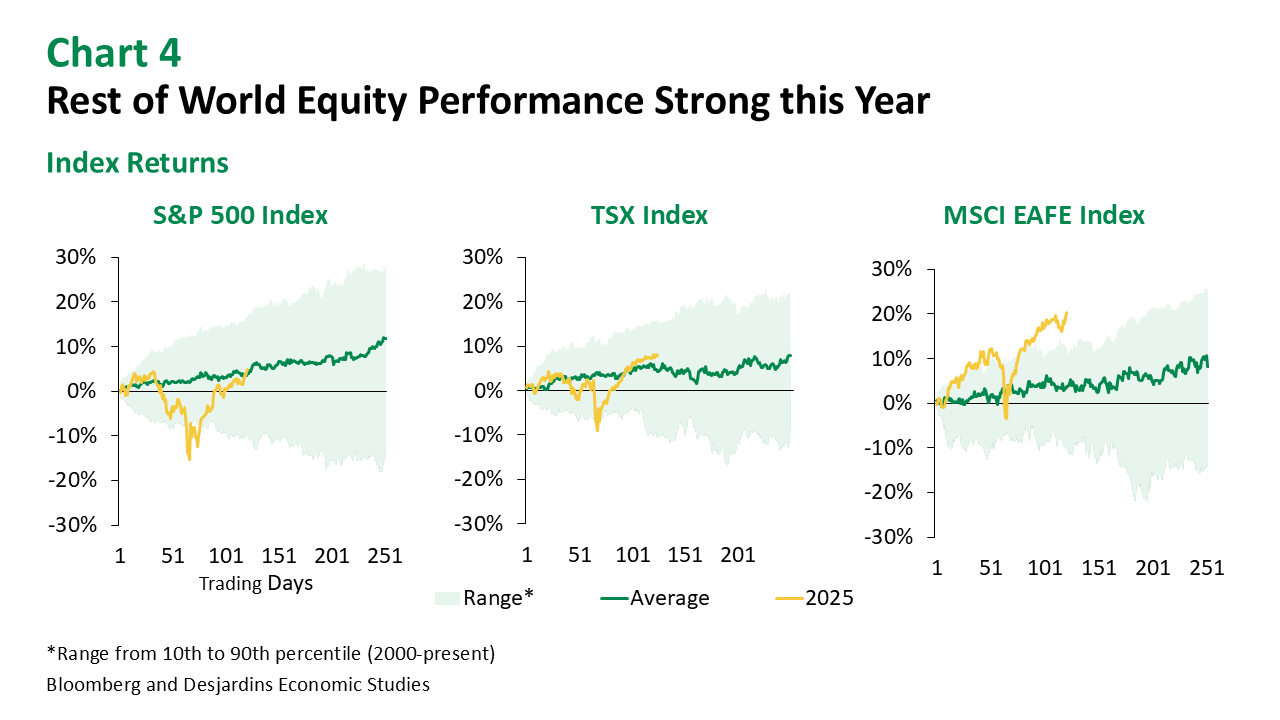
The latest headlines around German infrastructure and defence spending have boosted risk sentiment and we could see flows into European equities pick up. European financials have seen outflows in recent weeks, but investors remain net buyers of European industrial and defence names. We continue to see EAFE outperforming by the end of the year, but most of that comes from the stellar performance seen earlier this year (Graph 4).
Canadian equities likely to outperform the US near-term.
The TSX has made new highs post Liberation Day, while the S&P500 has struggled to do so. Part of this comes from composition. The TSX has benefited from the run up‑in commodity prices, particularly within the materials sector, where mining companies are benefiting from the rise in gold prices. This contrasts with the S&P500, which has a more diverse mix of materials manufacturers. Flows into Canadian equity mutual funds and ETFs have been larger as a share of assets under management relative to Europe and the US over the past month, but most of that buying is coming from domestic investors. Still, annualized Sharpe ratios based on year‑to‑date performance show that US equities have underperformed over a variety of metrics.
Corporate spreads remained near historical tights.
Canadian issuance continued to lag last year, with much of that due to the volatility seen in early April. Coupon reinvestment remains a factor weighing on spreads in both the US and Canada. Canadian corporate spreads are now unchanged since the start of the year, while US spreads are a touch wider. Although we still see scope for spreads to widen over the coming year, any increase is likely to be gradual.