- Jimmy Jean, Vice-President, Chief Economist and Strategist
Marc-Antoine Dumont, Senior Economist • Florence Jean-Jacobs, Principal Economist
Commodity Trends
Commodity Prices Are Expected to Increase Slightly
November 12, 2025
Summary
The global economy remains resilient, despite lingering tensions related to the rise of US protectionism. In the United States, the government shutdown in effect since October 1 has disrupted the release of key economic indicators. Without these numbers, it’s hard to get a clear picture of the labour market, household consumption, business investment and international trade. Absent reliable data, uncertainty remains high.
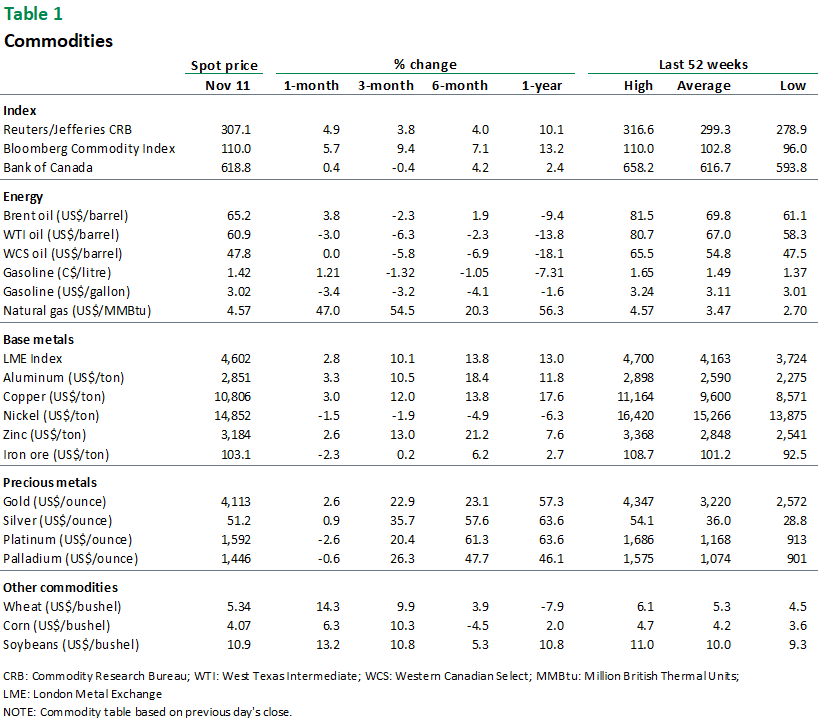
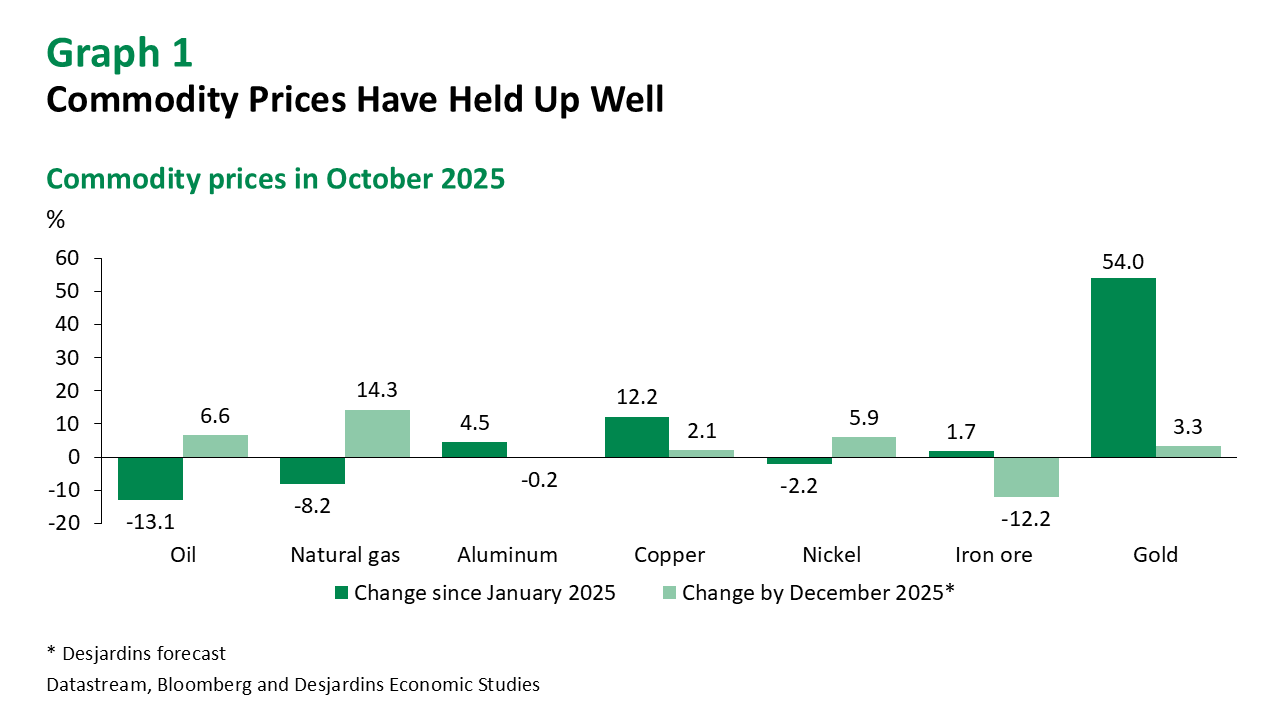
Despite the situation, commodity prices are holding up. Base metal prices are benefiting from surprisingly resilient global industrial production (graph 1). The price of gold skyrocketed before edging back down. We expect gold to continue to rise in the coming quarters. Oil prices have dipped recently, but they remain relatively stable as the market prepares for its biggest surplus since the pandemic. Agricultural commodity prices are fairly flat, while US trade policy is contributing to lumber price volatility.
Energy
Despite the Market Glut Expected in 2026, Oil Prices Are Holding Up
Forecasts
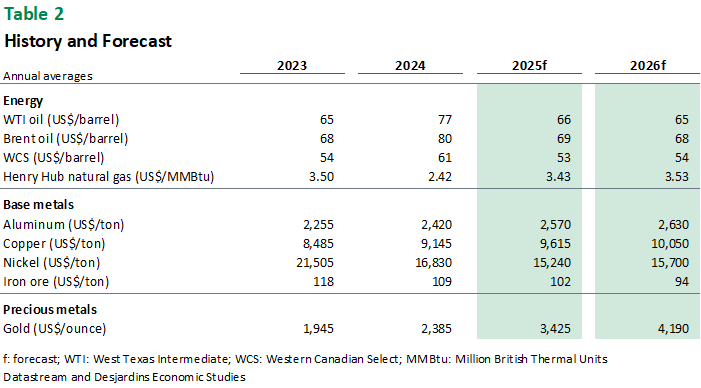
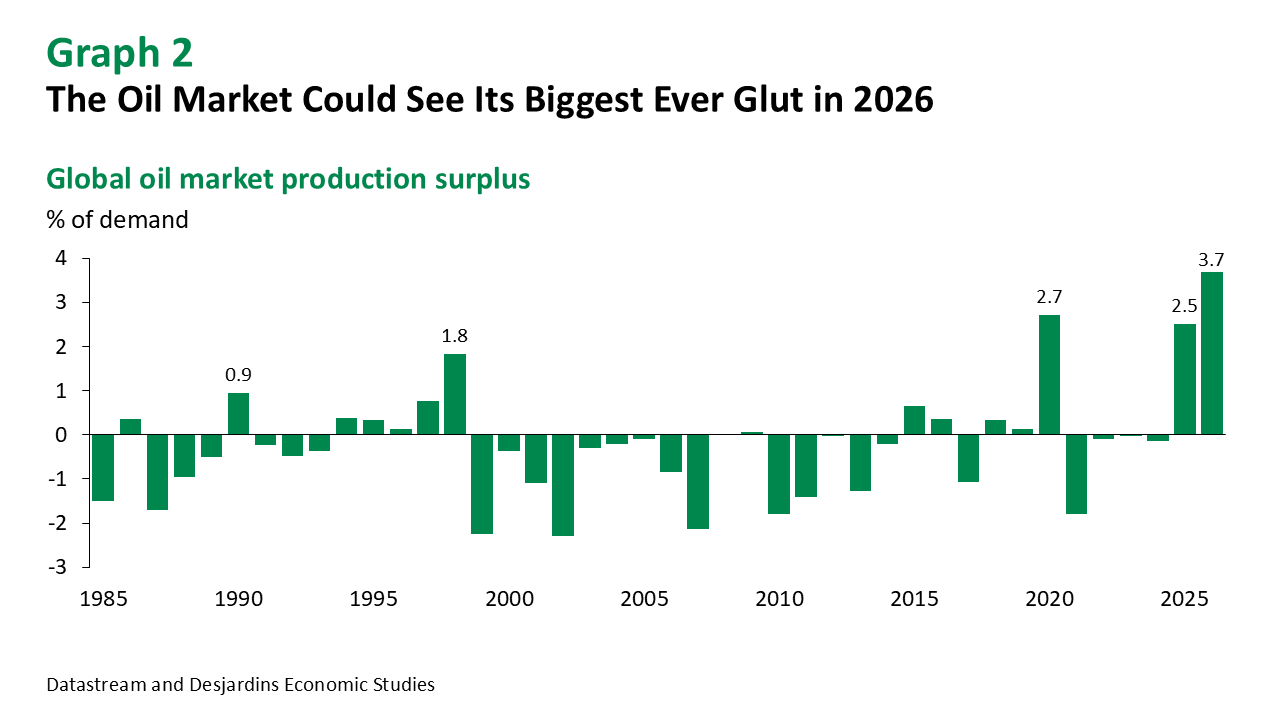
The biggest oil glut the world has ever seen could be in the cards for 2026, with estimated excess production of 3.9 million barrels per day (MMb/d). This imbalance is primarily due to increased supply, which is expected to jump by 2.4 MMb/d next year. However, the OPEC+ agreement to unwind voluntary output cuts will account for only about half of this anticipated increase, with the remainder expected to come primarily from the United States, Canada, Brazil, India and Guinea. At the same time, demand was rather weak this summer and is likely to remain so for the next few quarters. This explains the recent drop in oil prices. Nevertheless, we expect to see the price of West Texas Intermediate (WTI) recover some of its lost ground and end the year around US$63 per barrel. Looking ahead to next year, we expect the year-end target to be around US$65 per barrel, as fragmented oil markets and geopolitical tension are likely to limit downside price potential. However, a sharper correction is possible if the looming market glut proves to be as large as anticipated.
Oil
Global oil production was up 5.6 MMb/d year over year in September. This spike in output, 55% of which came from OPEC+, should generate the largest market surplus since the pandemic, with excess supply equal to 2.5% of demand in 2025 (graph 2). That said, we may break the record set in 2020 next year, when the market surplus could reach about 3.7% of demand. Although this glut has been in the forecast for several months now, and the supply trajectory remains in line with expectations for next year, crude prices have remained in the US$60–70 per barrel range until recently. This stability is partly due to the global economy’s resilience in the face of the trade war, and a degree of doubt as to whether these forecasts will materialize. However, fundamental changes in the structure of the oil market are also behind the current price levels.
First, geopolitical conflicts such as the war in Ukraine, sanctions on Iranian oil and the global disruption triggered by the Trump administration have fragmented oil trade flows. Russia and Iran are finding willing buyers of sanctioned oil in Asia, but this uncertainty continues to put some upward pressure on prices. As a result, new sanctions have been added that directly target Russian companies, which could further fragment supply. Second, China has accumulated a huge surplus, with its stockpile estimated to have grown by 109.5 million barrels since April, almost completely absorbing OPEC+ production increases over the summer and stabilizing prices. Washington is also planning to add one million barrels to its Strategic Petroleum Reserve, although this amount is negligible compared to the reserve’s total capacity of 408 million barrels, and the impact on WTI is therefore likely to remain limited. Overall, stockpiling and fragmented supply could mitigate the impact of the expected glut in 2026.
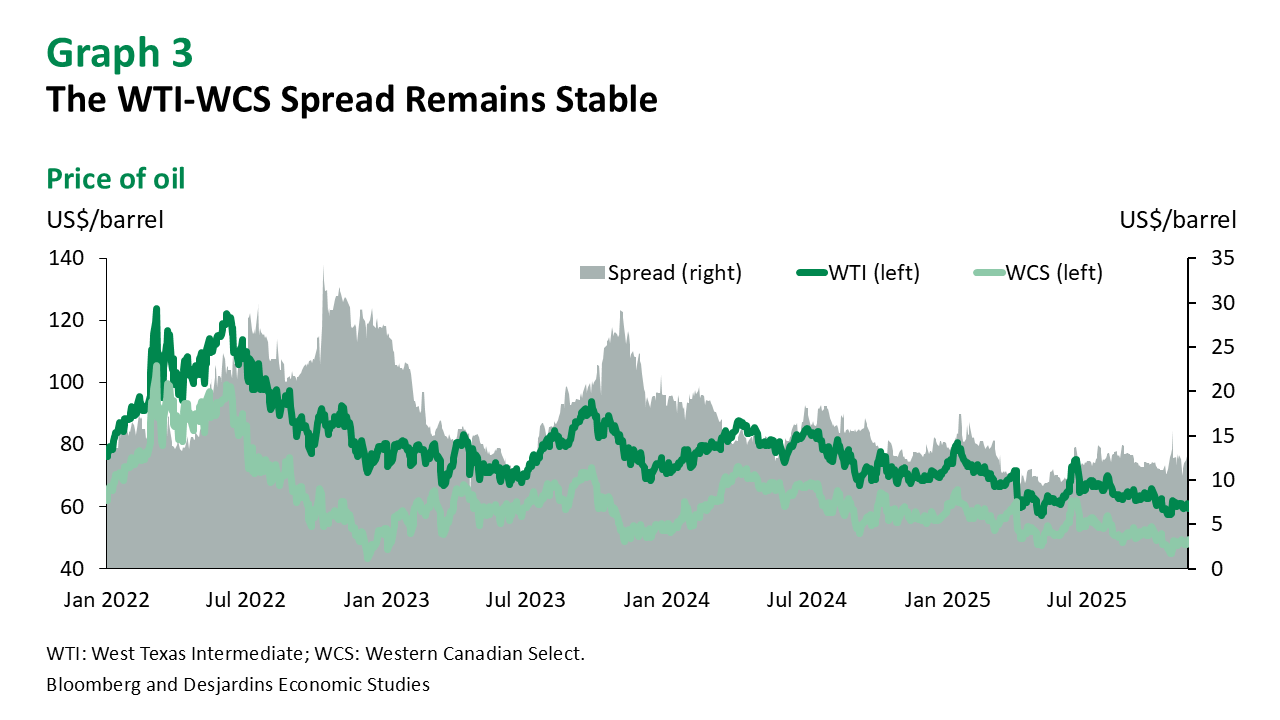
Canadian producers are managing to navigate tariffs and the resulting uncertainty for now. The CUSMA compliance rate for oil exports to the United States is over 96%, allowing Canadian oil to enter the market tariff-free. Despite a temporary drop in production of 0.3 MMb/d in September due to facility maintenance, Canadian oil output is expected to grow 3.3% this year and 1.7% in 2026. However, Canadian exports have declined since the beginning of the year (-11.4%), mainly due to lower shipments to the United States (-13.1%). Deliveries to China—now possible via the TMX pipeline—only offset about 10% of this loss. These lower trade volumes are keeping the WTI/WCS (Western Canadian Select) spread close to US$11 per barrel (graph 3).
South of the border, producers are more pessimistic. According to the latest survey from the Federal Reserve Bank of Dallas, 78% of US producers delayed investments because of uncertainty. In addition, the business activity index, which measures oil industry sentiment, posted its second consecutive quarter of negative data for the first time since the pandemic. That said, US production is still expected to rise in the coming quarters, but a further decline in crude prices could jeopardize this outlook.
Gasoline
US demand for gasoline during the summer was rather soft and fell 0.2% between the second and third quarters, well below the usual seasonal increase of 1%. While increased take-up of electric vehicles and improved energy efficiency are partly responsible for this divergence from the historical trend, other factors are clearly at play. The decline in international tourism, particularly among Canadians who tend to take road trips, also contributed to this weakness. All in all, gasoline prices are likely to reflect more subdued demand and stable crude oil prices in the coming months.
Natural Gas
Henry Hub natural gas prices have shed 19% since the beginning of the year, as a result of sustained US production and weaker-than-expected residential demand due to mild temperatures in recent months. US gas inventories are also above their five-year average, adding to the recent downward pressure on prices. In addition, so far the Gulf of Mexico has come through this year’s hurricane season unscathed, so production and exports have not suffered the disruptions we usually see in late summer and early autumn. As colder temperatures set in, natural gas prices are expected to begin their seasonal increase and end the year around US$3.40 per MMBtu.
For next year, uncertainty surrounding demand remains high, particularly due to the delayed effects of the trade war. China has held up fairly well against US tariffs up to now, and its industrial production appears to be little affected, which has helped to maintain the natural gas price floor. That said, China’s economy could deteriorate in 2026. Europe continues to increase its natural gas imports from the US as it looks to replace gas previously sourced from Russia. However, the European industrial sector has been sluggish since the pandemic, which is limiting renewed demand. We expect Henry Hub to end 2026 at around US$3.60 per MMBtu.
Base Metals
Metal Prices Remain Resilient Despite Surpluses
Forecasts
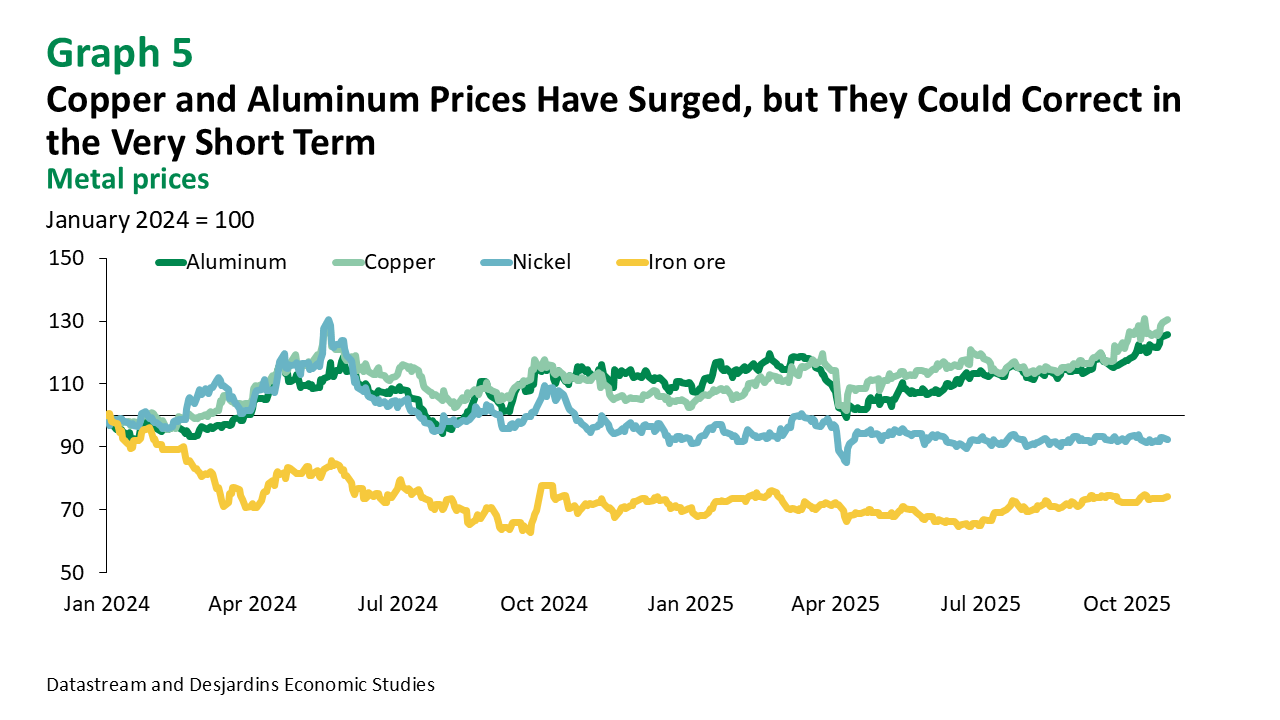
Although prices for aluminum, copper and iron ore have risen in recent weeks, their respective markets remain in surplus. As a result, current price levels are somewhat overvalued and all three are likely to soften in the very short term. That said, we continue to expect prices to edge back up in 2026, especially as advanced economies reindustrialize and militarize. Iron ore is an exception to this trend as growth in mining production is likely to push this market into a large surplus next year. We therefore expect the price of iron ore to fall in the coming quarters.
Aluminum
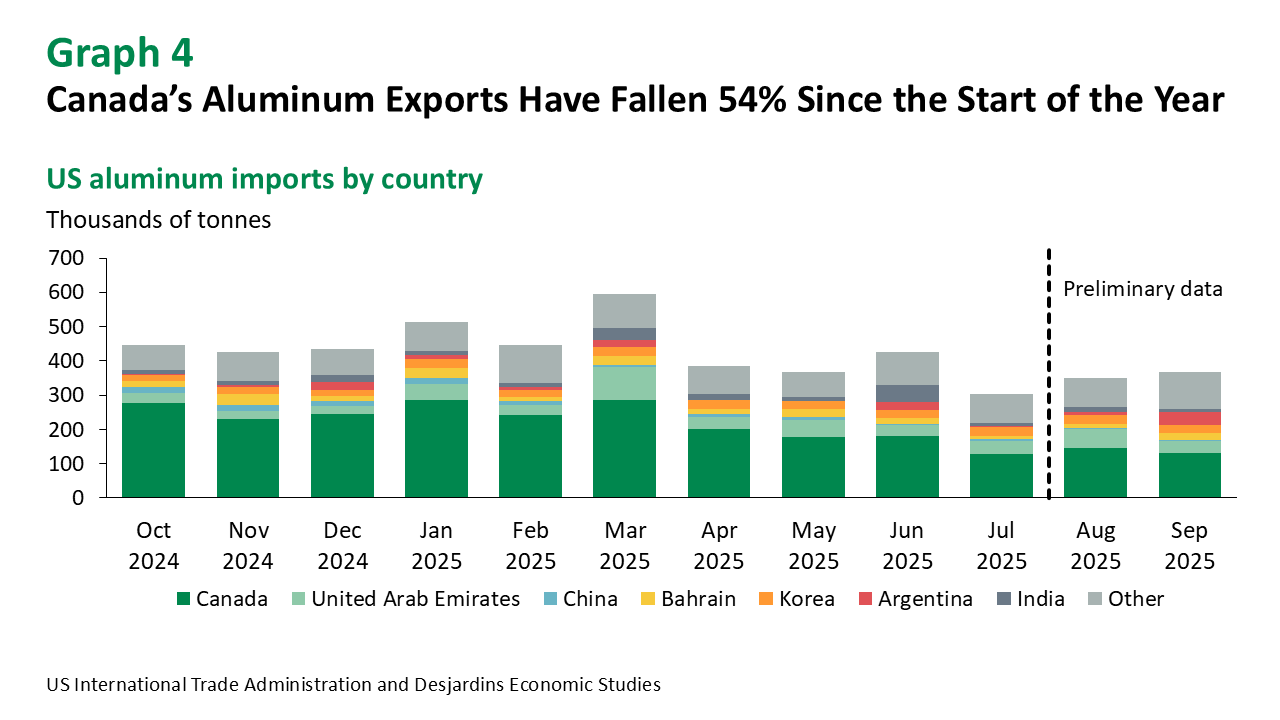
Disruptions to Icelandic production have caused prices to spike 6% since the beginning of September. However, this surge could be short-lived, as the global market remains in a slight surplus and the situation in Iceland should stabilize. That said, this disruption is not the only factor behind the recent price appreciation. Weakness in Canadian exports, which have fallen 54% since the start of the year (graph 4), has also helped to support prices as global supply continues to fragment. Quebec’s aluminum industry is looking to diversify its export markets, especially into Europe, but no market will be able to completely replace the United States. In 2024, the US imported 3.2 million tonnes of Canadian aluminum, representing 58% of their total imports. Canada’s recent entry into the European market this summer has offset only about 16% of volume losses to the United States.
Quebec’s aluminum producers are still in good shape for now. They continue to enjoy comparative advantages—their production processes are greener than their competitors, and their energy costs are low. The United States relies heavily on imports to meet its domestic demand. Even though their industries can draw from their inventories for some time, they’ll eventually have to start importing aluminum again. However, the timing remains uncertain, and inventory levels are difficult to assess. Meanwhile, Quebec’s aluminum producers will benefit from a slight increase in global metal prices. We expect aluminum to end 2026 at approximately US$2,600 per tonne.
Copper
Global copper supply tightened over the past month following a fatal accident that temporarily shut down the Grasberg mine in Indonesia—the world’s second-largest copper mine, responsible for about 3% of global output. Additional data suggests that production at several other sites may fall short of expectations, increasing the risk of further pressures on supply. As a result, copper prices have surged nearly 8% since early September, reaching approximately US$10,500 per tonne (graph 5). Although the previously forecast surplus for 2025 is now less certain, unreported inventories are expected to re-enter the market in the coming weeks, which could exert downward pressure on prices. In the very short term, copper prices may dip slightly before trending back upward, supported by long-term fundamentals such as the structural deficit anticipated later this decade. Our year-end 2026 target is still US$10,200 per tonne.
Nickel
Despite low prices, nickel production has remained resilient, particularly in Indonesia, where government efforts to curb supply seem to have limited short-term impact. In Western countries, producers are struggling to cover costs and have been forced to scale back or shut down operations. In Canada, some producers have shifted to other ores like copper where feasible, but the situation remains challenging. The market surplus is not only expected to continue for a third consecutive year (into 2026), but it may also exceed initial projections. Accordingly, we’ve revised our 2026 nickel price forecast downward to US$16,000 per tonne. Medium-term prospects are more encouraging. The energy transition is ongoing, albeit at a slower pace, and is expected to lend support to prices.
Iron Ore
Production at the new Simandou mine in Guinea is set to begin in November, positioning it as the world’s largest iron ore extraction site. Its high-quality output will compete directly with Canadian mines. Demand for this type of ore is rising as the steel industry shifts from coal-based furnaces to cleaner electric arc furnaces, which require high-purity inputs. This trend has helped maintain the premium on high-quality iron ore at US$14 per tonne, close to its historical average (excluding the pandemic).
However, the overall outlook for iron isn’t quite so promising. The opening of the new mine will exacerbate the market surplus, while demand remains fragile—especially in China, where the property sector remains in crisis, with both housing starts and average home prices falling. China accounts for half of global iron and steel demand, with construction representing 40% of its consumption. Under these conditions, we expect iron ore prices to decline in 2026, ending the year at around US$92 per tonne.
Precious Metals
Gold Prices Slipped After Setting a New Record
Forecasts
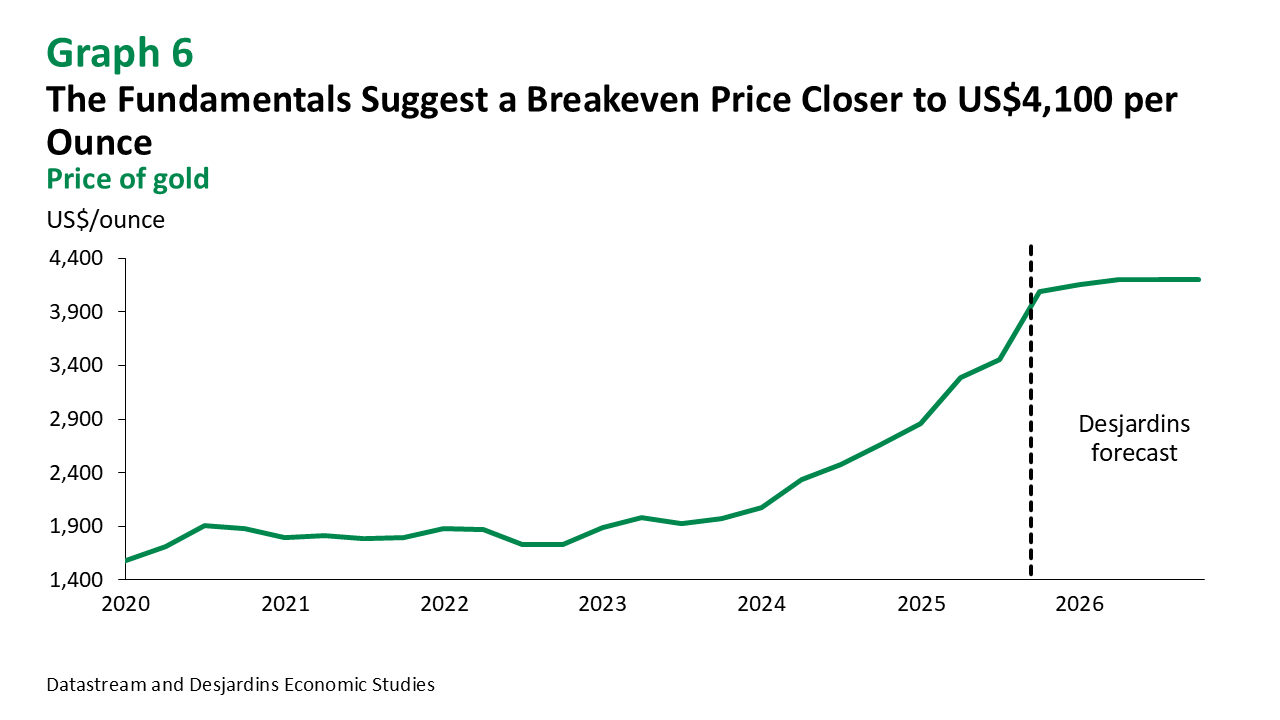
A perfect storm of factors is currently driving up gold prices: anticipated interest rate cuts, mounting inflationary pressures, a weakening greenback, US federal government gridlock, concerns that certain financial securities may be overvalued, and global geopolitical instability. All of these factors are supporting gold’s upward trajectory, which is expected to continue in the coming quarters. That said, the fundamentals point to a breakeven price of around US$4,100 per ounce, which means the recent correction is no surprise. Volatility and speculation remain high on the gold market, potentially leading to significant price swings in either direction. For 2026, we anticipate a more moderate increase, with gold prices projected to end the year near US$4,200 per ounce.
Gold and Silver
Since mid-September, gold prices have risen by over US$600 per ounce (a 16% increase), peaking at US$4,350 before retreating to around US$4,150. This surge was largely driven by the US government shutdown, dollar depreciation, and speculation. Donald Trump’s recent announcement of potential new tariffs on China also helped trigger the market reaction. Along with concerns about overvalued AI stocks and emerging risks to the regional banking sector, these tensions have led many investors to seek a safe haven in gold. Inflows to gold exchange-traded funds (ETFs) have skyrocketed, reaching 59.2 tonnes during the week of October 17, comparable to the pandemic-era peak in 2020. Gold trading volumes also rose sharply, with the daily average rising from US$290.2 billion in June to US$388.3 billion in September. These trends reflect heightened anxiety among investors, who are seeking protection against a multitude of current risks, despite surging stock indexes. We therefore expect gold prices to continue climbing (graph 6). Silver has outperformed gold, gaining 28% since mid-September. But abundant supply could lead prices back down in the coming months.
Platinum and Palladium
As with gold, increased demand for safe-haven assets also boosted platinum and palladium prices, which have advanced by 18% and 30%, respectively, since mid-September. Yet weakening industrial demand may limit further price gains over the next several months. This is especially true for platinum, which has become so expensive that many manufacturers have switched to palladium—helping explain the difference in price growth between the two metals. What’s more, Russia produces around half the world’s palladium, and the possibility of new sanctions by the US and EU has helped boost its price in recent weeks.
Other Commodities
Forest Products Face Turmoil as Agriculture Remains Stable
Forest Products
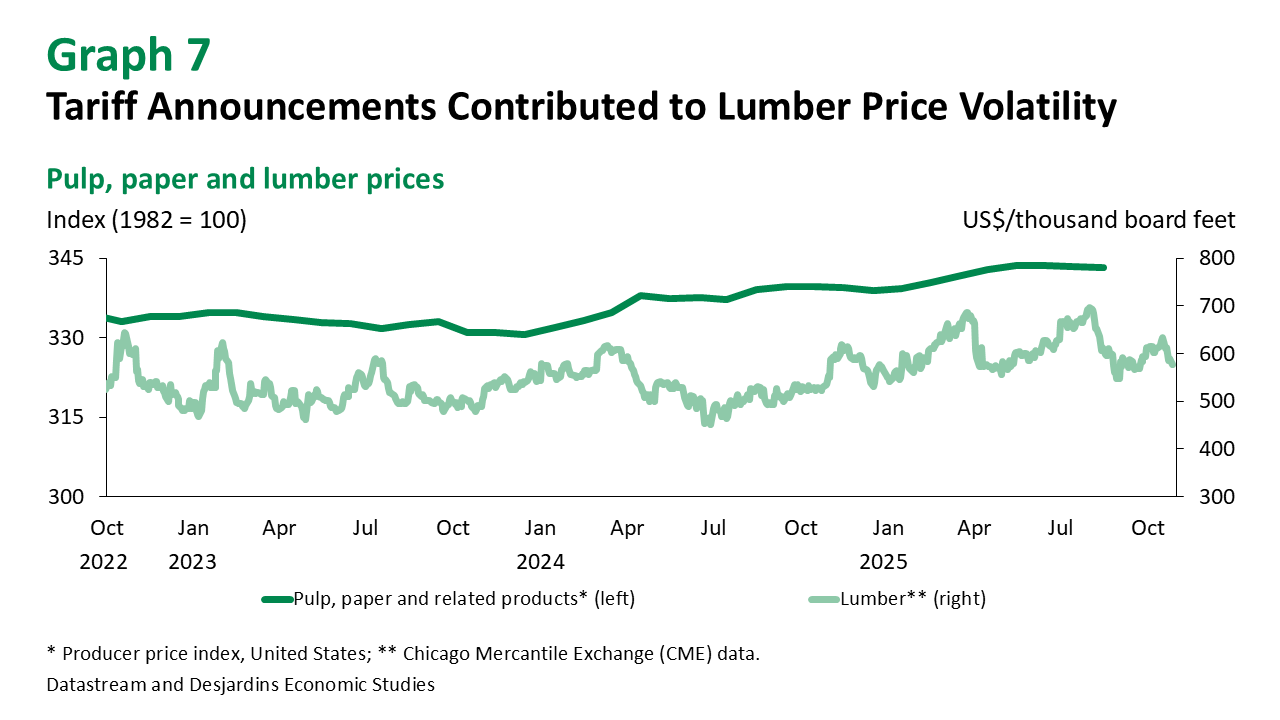
The Canadian forestry sector faced considerable uncertainty throughout the year. Erratic tariff announcements contributed to fluctuations in softwood lumber prices (graph 7). In mid-August, countervailing and anti-dumping duties doubled to 35%, followed by an additional 10% tariff imposed on October 14, bringing the total to 45%. This basically eliminated the historical comparative advantage of Canadian softwood in the US market. European competitors are capitalizing on this opportunity to expand their market share in the United States. Weak US housing starts have put downward pressure on lumber prices, compounded by a recent spike in US production of southern yellow pine. But this type of lumber, grown in the southern United States, lacks the structural strength of northern softwoods, including those from Canada, making it an imperfect substitute for house framing.
Canadian sawmills are expected to reduce production due to unfavourable conditions, including low prices and the need to absorb most of the cost of tariffs to remain competitive in the United States. Temporary shutdowns have already occurred in the past few months, while permanent closures are anticipated in Western Canada. Shrinking supply will likely act as a kind of counterbalance in coming months, moderating price declines. All things considered, we expect North American softwood lumber prices to remain low (though not drop significantly) until the spring, when they may rebound if US construction activity picks up. But this potential recovery faces some downside risks. A sensible strategy for Canadian businesses would be to focus on the domestic market and diversify into Europe, which has become more attractive due to the trade barriers imposed by the US.
Agricultural Commodities
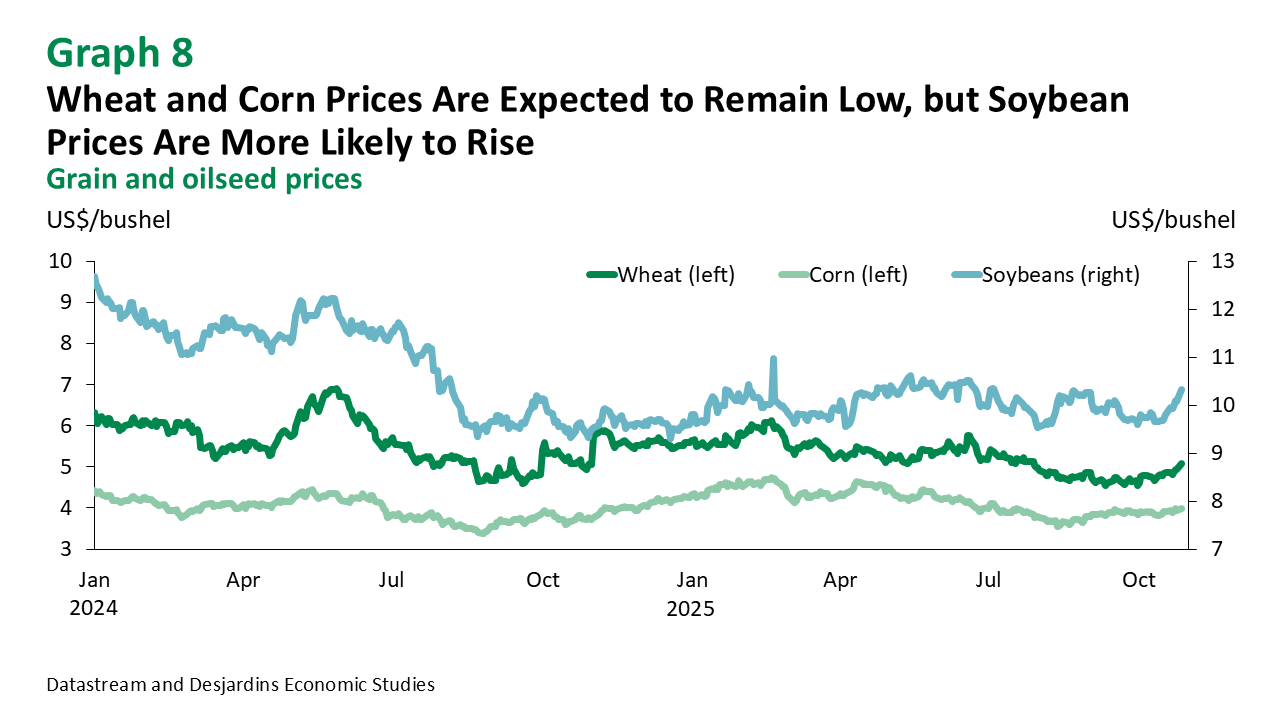
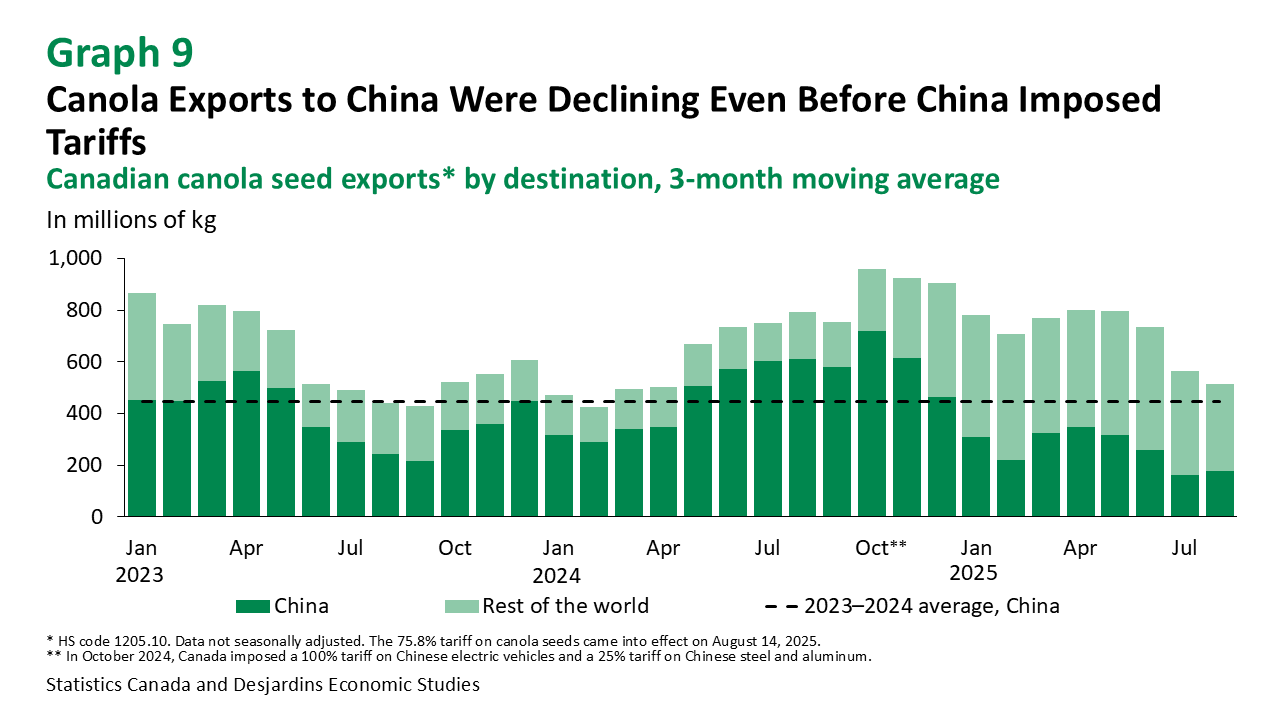
Agricultural prices remain relatively low and stable (graph 8). Corn prices are expected to hover around their current, relatively low, levels in the coming months, while soybean prices may see modest gains. China continues to shun US soybeans, with record Brazilian soybean exports stepping in to fill the gap. As for future wheat prices, we’ll be keeping a close eye on the winter harvest in the United States, Europe and around the Black Sea. For now, wheat prices are near five-year lows. Canadian canola exports to China declined due to trade tensions between the two countries, even before the 75.8% tariff took effect in August (graph 9). This has primarily impacted Saskatchewan, Alberta and Manitoba. Rising exports to Japan have only partially offset these losses.
Commodity Prices