- Royce Mendes
Managing Director and Head of Macro Strategy
Weekly Commentary
What’s the Opposite of Sticky?
August 22, 2025
To make the case that core inflation is sticky in Canada, there would need to be evidence that underlying price pressures are persistently strong. Other than the year-over-year rates of core inflation, which are being heavily influenced by CPI readings from some time ago, there’s little to suggest that there’s anything amiss with the trend in price growth. The average of the three-month annualized rates of core trimmed mean and median inflation fell all the way down to 2.4% in July from 3.4% in June, the lowest reading since September 2024.
What some have called sticky inflation in the past few months is nothing more than an illusion. As we’ve stated time and time again, the April core inflation print was skewed higher by a myriad of one-off factors, making the data for that month mostly noise. There’s no clearer way to see that than in the monthly distributions of price changes across categories. The April distribution was nowhere close to normal, which has meant that the three-month annualized readings haven’t been “clean” since March.
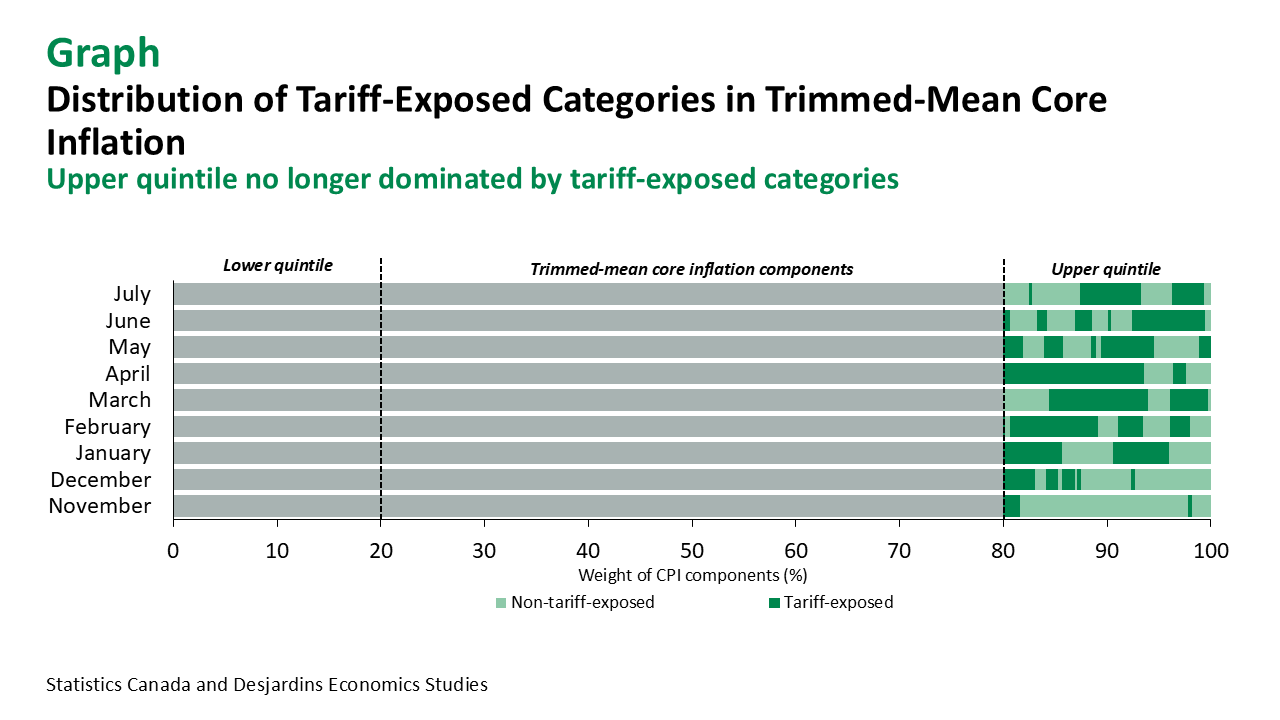
In part, the April spike was seemingly driven by retaliatory tariff-related price increases. Our research has pointed out that January, February, March and April saw unusually large increases in tariff-exposed sectors (graph). But those pressures have been progressively subsiding since May. In fact, the July data show the smallest share of tariff-exposed categories in the upper quartile of the CPI distribution since December 2024. It’s plain to see that outside of the year-over-year measures of price growth, most fears about inflation should be moving into the rearview mirror.
In contrast, the main contributors to headline inflation have been rent and mortgage interest costs. Given that asking rents are falling across the country, it seems like only a matter of time until rent inflation, as measured in CPI, shifts into a lower gear. We estimate that there is an eight-month lag between changes in asking rents and correspondent moves in CPI rent inflation. Our models also suggest that the mortgage interest cost contribution to inflation will continue to shrink over the remainder of this year.
As a result, the only real argument in favour of holding back further monetary stimulus rests on the debate regarding whether past rate cuts are still working their way through the economy. According to the Bank of Canada’s own models, the vast majority of impacts from a change in monetary policy occur within the first six months of a move, all else equal. Incidentally, by the time of the September rate decision, it will have been six months since the last rate cut.
Keep in mind, though, that all else is not equal. So far this year, term premia on 10-year Government of Canada bonds have increased roughly 60 basis points, dragged higher by the rise in global term premia. According to the central bank’s simulations, that could be enough to offset a chunk of the stimulus provided by both the January and March rate cuts, even after accounting for tightening credit spreads and rising equity prices.
We continue to believe that the market is underpriced for the monetary easing the Bank of Canada will need to deliver to restore the economy to full health. This week’s inflation data reinforced our view that trade frictions are hurting the economy much more than they are stoking inflation. With the market already braced for a series of Fed rate cuts, we still see Canada–US spreads widening before they begin to narrow again.