- LJ Valencia, Economist
Economic News
Canada: Tariffs Loom Large Over a Smaller Trade Deficit in July
September 4, 2025
Highlights
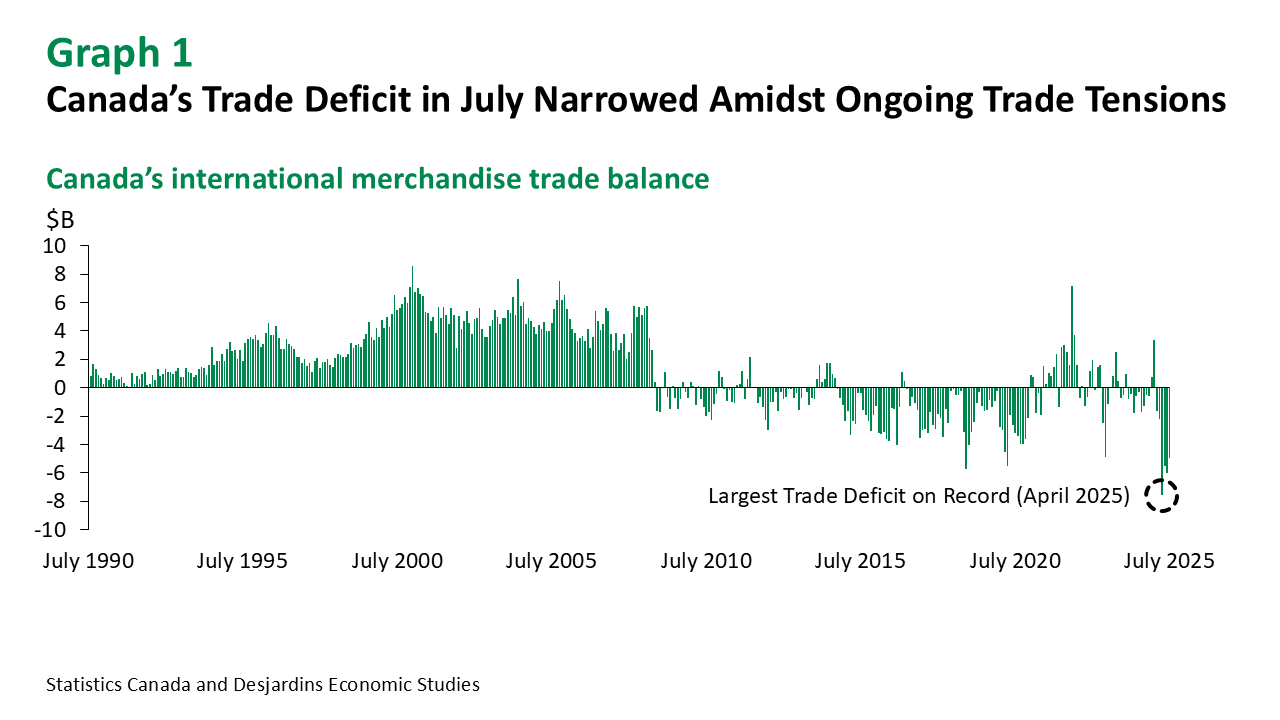
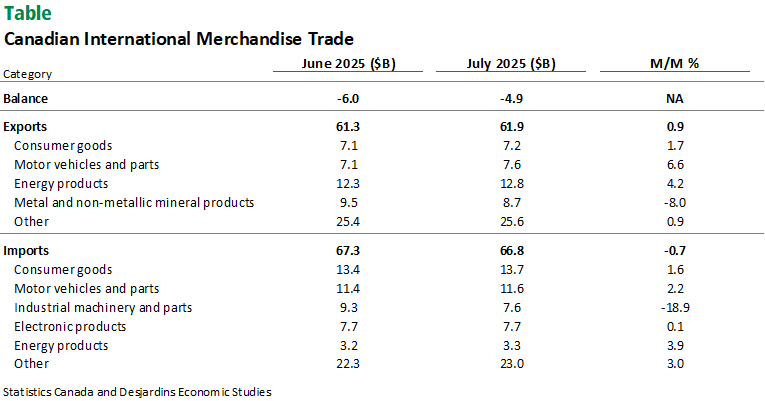
- Canada’s international merchandise trade deficit narrowed to $4.9B in July from $6.0B in the prior month (graph 1). This was better than the consensus expectation for a deficit of $5.3B. See table for more details.
- Goods exports rose by 0.9% m/m in July—the third consecutive increase. Imports fell by 0.7%, a reversal from the increase in the prior month. In real terms, exports were up 0.7% while imports decreased by 1.8%.
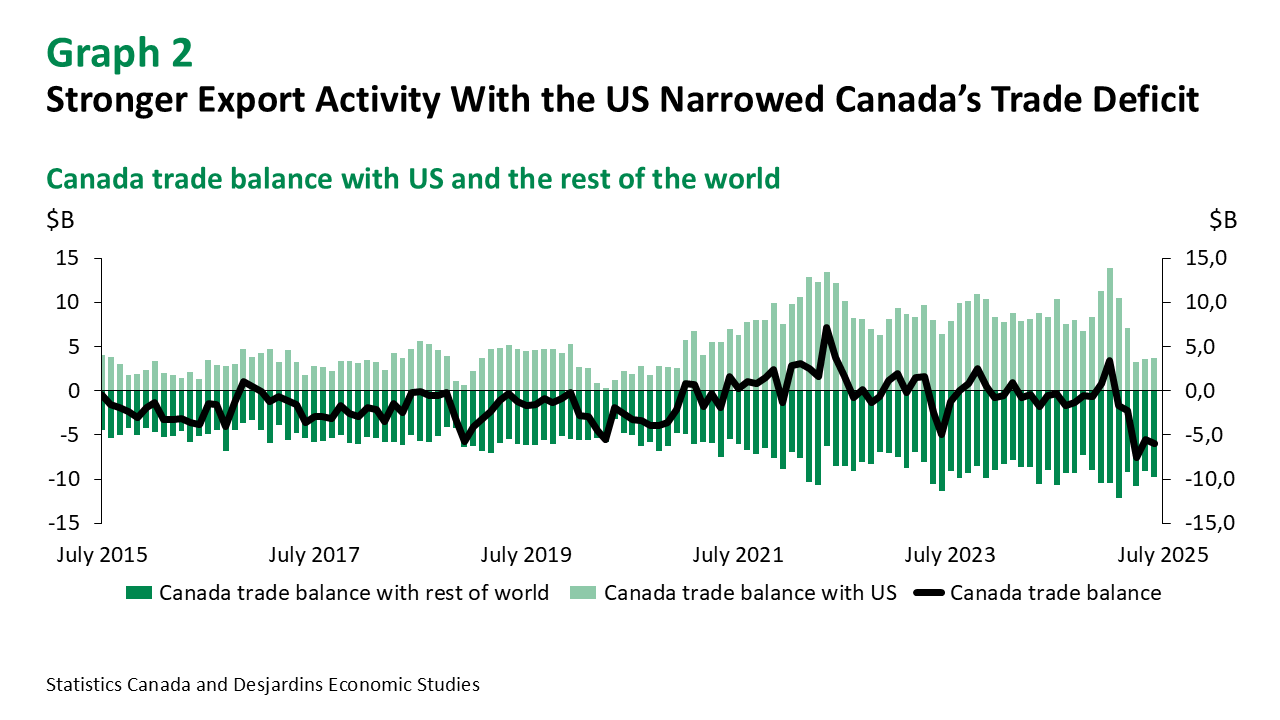
- Canada’s trade surplus with the US rose from $3.7B to $6.7B in July – the largest surplus since March 2025 (graph 2). Meanwhile, the trade deficit with countries other than the United States widened from $9.7B to $11.7B in the month.
- Services trade in July posted a $504M surplus. Exports of services rose by 2.6% while services imports fell by 1.3%.
Comments
Characterizing Canada’s recent dismal trade performance has become an exercise in adjectives. However, seven out of 11 export categories experienced an increase in July. Energy exports contributed heavily to export growth in the month (4.2% m/m), on the back of higher crude oil export prices and volumes. Motor vehicles and parts exports increased in July (6.6%), as summer shutdowns were less disruptive than usual due to earlier production slowdowns caused by US tariffs. That said, exports of motor vehicles were up around 4% in July over the same month last year. In contrast, metal and non-metallic mineral products declined (-8.0%), which can be primarily attributed to falling exports of precious metals. Exports of aluminum fell sharply (-31.0%) – the fourth consecutive decline and the lowest level since May 2019. This coincided with higher US tariffs on Canadian steel and aluminum.
On the import side, Statistics Canada again noted that the CBSA's Assessment and Revenue Management (CARM) initiative significantly revised import values from November 2024 to July 2025, so import data should be viewed cautiously. The import decline was mainly driven by a significant fall in industrial machinery, equipment and parts (-18.8%). This follows a one-time, high-value import in the prior month for an oil project off the coast of Newfoundland. In contrast, ten out of 11 import categories posted gains. Significant contributions came from products such as aircraft and other transportation equipment and parts (11.0%), motor vehicles and parts (2.2%), and consumer goods (1.6%).
Implications
While today’s narrower trade deficit is welcome news, the path ahead is still uncertain. Reflecting the July trade data, net exports are now expected to contribute 1.5 percentage points to Q3 output growth. We expect real GDP growth to be roughly flat in the quarter. This is below the Bank of Canada's July Monetary Policy Report forecast of 1% annualized.
Looking ahead, ongoing trade tensions and uncertainty continue to adversely impact Canadian economic activity and influence the decisions of central bankers. That said, our recent analysis External link. on the reduction of retaliatory tariffs points to stronger growth and weaker inflation in the coming quarters than otherwise.