Is the long-term corporate credit market disconnected from its fundamentals?

Canada’s long-term corporate bond spreads have tightened considerably since 2022, reaching historically low levels. The tightening is especially pronounced when we compare long-term corporate bonds and provincial bonds, whose average spreads are approaching their lowest levels since April 2007. In an uncertain economic environment fraught with geopolitical instability, tariff-related volatility, and inflationary pressure, we would instead expect risk premiums on long-term corporate bonds to go up.
Long-term credit spreads: Corporate bonds vs provincial bonds
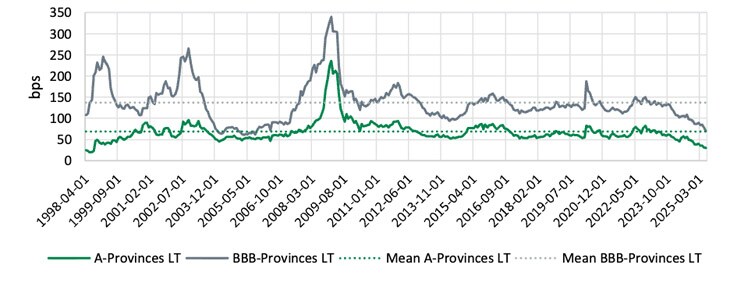
Sources: FTSE, DGAM
Description of the Chart of Long-Term Credit Spreads: Corporate bonds vs Provincial bonds
This chart shows long-term credit spreads for A and BBB-rated provincial bonds, measured in basis points (bps) from April 1998 to April 2025.
The chart has 2 lines:
- The green line represents A-rated provincial bonds (A-Provinces LT).
- The gray line represents BBB-rated provincial bonds (BBB-Provinces LT).
Dotted lines indicate the historical averages for each rating category.
General Trends Observed
- Significant peaks appear around 2009–2010, corresponding to the financial crisis.
- A general downward trend in spreads is observed toward the end of the period, suggesting improving credit conditions.
What has caused this situation? Is it sustainable? And, above all, what does it mean for institutional investors? In this document, our team of fixed income managers at Desjardins Global Asset Management (DGAM) explore potential solutions to understand this phenomenon. A must-read for anyone seeking the informed perspective needed to navigate a rapidly changing bond market.
Potential causes
1. A relative supply shock: An unprecedented imbalance has developed between provincial and corporate issuance in the long-term segment
The funding profile in Canada has undergone a major shift in recent years. Is it temporary or structural? Only time will tell. But the figures leave no doubt:
- The provinces have issued more than $50 billion above their historical trend, mostly to fund post-pandemic budget deficits, infrastructure, and social programs.
- Corporations have reduced their issuance by nearly $20 billion relative to their historical trend, amid higher financing costs, increased caution in an uncertain economic environment, and easier access to other sources of financing, such as accumulated liquidity, bank loans, and foreign markets.
This $70-billion net imbalance in the relative supply of long-term bonds is unprecedented since the 2008 crisis. With fewer corporate bonds available to investors and more provincial bonds outstanding, the imbalance creates a relative scarcity of long-dated corporate credit and in all likelihood has contributed to the historic credit spread compression seen since 2022.
Long-term Canadian credit bonds outstanding
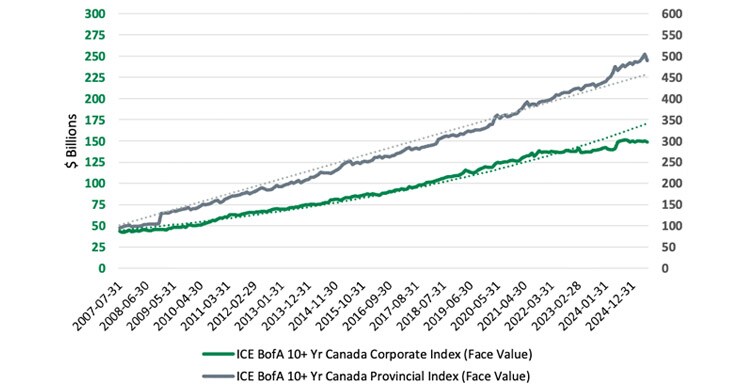
Sources: ICE, Bloomberg, DGAM
Description of the Chart of Long-Term Canadian Credit Bonds Outstanding
This chart shows the nominal value evolution of long-term credit bonds in Canada, for both corporate and provincial bonds from July 31, 2007, to July 31, 2024.
The chart has 2 vertical scales:
- Left axis: Value in billions of dollars (from 0 to 300)
- Right axis: Value in billions of dollars (from 0 to 550)
The chart has 2 lines:
- The green line represents the ICE BofA 10+ Yr Canada Corporate Index (nominal value of corporate bonds).
- The gray line represents the ICE BofA 10+ Yr Canada Provincial Index (nominal value of provincial bonds).
General Trends Observed
- Both types of bonds show a steady increase in outstanding value.
- Provincial bonds have grown more significantly than corporate bonds over the observed period.
Long-term Canadian credit bonds outstanding within the Canadian universe
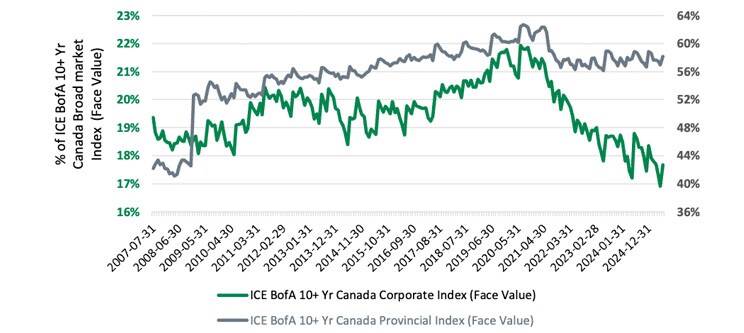
Sources: ICE, Bloomberg, DGAM
Description of the Chart of Long-Term Canadian Credit Bonds Outstanding within the Canadian Universe
This chart shows the relative share of corporate and provincial bonds within the Canadian long-term credit bond universe, based on nominal value from July 31, 2007, to July 31, 2024.
The chart has 2 vertical scales:
- Left axis: Percentage (%) of corporate bonds (from 16% to 23%)
- Right axis: Percentage (%) of provincial bonds (from 36% to 64%)
The chart has 2 lines:
- The green line represents the ICE BofA 10+ Yr Canada Corporate Index (relative share in the overall universe).
- The gray line represents the ICE BofA 10+ Yr Canada Provincial Index (relative share in the overall universe).
General Trends Observed
- The relative shares of both types of bonds fluctuate over time.
- Provincial bonds consistently represent a larger portion of the universe compared to corporate bonds.
Not only has supply become unbalanced, but demand has also undergone a profound transformation.
2. Changing institutional demand: Defined-benefit pension plans now have surpluses and are reallocating massively to long-term fixed income
Defined-benefit (DB) pension plans, which are strong proponents of liability-driven investing, have undergone a notable turnaround in recent years. After a decade of significant challenges caused by the 2008 financial crisis, such as actuarial deficits, contribution increases, and market volatility, their financial strength has greatly improved.
With a favourable combination of solid returns, higher interest rates, and excess contributions, many plans are posting actuarial surpluses. This context opens the door to a strategic reallocation of assets, particularly to long-term bonds, for three main reasons:
- Plan maturity
Many DB plans are maturing, with an increasing proportion of retirees relative to active members. As a result, they are reducing volatility and securing future cashflows, which encourages investment in long-term bonds.
- Accounting effect: A discount rate independent of allocation
Financial statements use a discount rate based on a reference curve composed of high-quality corporate bonds. The rate, which is independent of the portfolio’s actual composition, encourages plans to align with the curve to reduce accounting volatility.
- Solvency: A key criterion for annuity purchases
The yield curves used to assess solvency are partially based on high-quality corporate bonds, often combined with sovereign securities. A high discount rate reduces the value of future undertakings, improves the solvency ratio, and makes annuity purchases more accessible. This encourages plans to align their portfolios with the components of the solvency curve, including long-term corporate bonds, to reduce the risk of mismatch and facilitate the management of undertakings transferred to insurers.
Result: Increased demand for long-duration fixed income securities, particularly long-term corporate bonds, as plans seek a secure return and better asset-liability matching in a more favourable financial environment.
Financial health index of pension plans
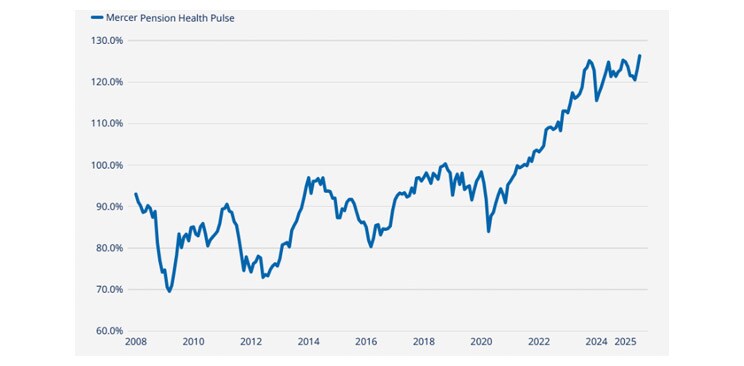
Source: Mercer Pension Health Pulse
Description of the chart of the Mercer Pension Health Pulse
This chart shows the evolution of the financial health index of pension plans over time from 2008 to 2025.
Vertical scale: Percentage (%) ranging from 60% to 130%
The chart has a blue line representing the financial health index, showing notable fluctuations throughout the period.
General Trends Observed
- The index starts below 80% in 2008.
- It experiences several ups and downs, with distinct peaks and troughs.
- By around 2024, the index rises above 120%, indicating a significant improvement in the financial health of pension plans.
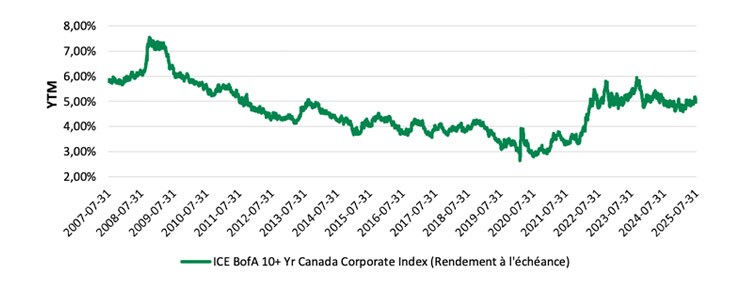
Yield-to-maturity of long-term Canadian credit bonds
Sources: ICE, Bloomberg
Description of the Chart of Long-Term Canadian Credit Bonds – YTD
This chart shows the Yield to Maturity (YTM) of long-term Canadian credit bonds from July 31, 2007, to July 31, 2025.
Vertical Scale: Yield to Maturity in percentage (%) ranging from 2.00% to 8.00%
The chart has a green line representing the ICE BofA 10+ Yr Canada Corporate Index (Yield to Maturity).
General Trends Observed
- YTM fluctuates over time.
- Notable peaks appear around mid-2009 and early 2021.
- The chart reflects changing market conditions and interest rate environments over the period.
3. A regulatory catalyst: The coming into force of IFRS 17 is causing life insurers to increase their exposure to long-term corporate bonds
IFRS 17, which came into force on January 1, 2023, has profoundly changed the way life insurers value their liabilities. By redefining accounting parameters, IFRS 17 has created an incentive for them to increase their exposure to corporate bonds, particularly the long-term segment—a natural habitat for the industry.
This regulatory change acts as a structural driver of demand for long-term corporate credit. IFRS 17 hasn’t just changed accounting rules; it is also actively reconfiguring demand in the bond market, adding to the downward pressure on long-term credit spreads.
Conclusion
The recent behaviour of the long-term corporate credit market flies in the face of traditional expectations. The macroeconomic signals suggest that spreads should be widening; instead, persistent compression is narrowing spreads to unprecedented levels.
What if, beyond all the learned economic theories that could justify the significant tightening of long-term corporate credit spreads vis-à-vis provincial securities, we reverted to the simplest explanation: a supply and demand shock creating a perfect storm for a one-off market imbalance?
The question we must ask ourselves is this: Are investors still adequately compensated for the risk they assume in a context where some fundamentals seem to have taken a back seat, or is the market sending out signals that are outside historical norms?
Implications for institutional investors
These observations and questions call for adapted investment strategies. Here are three key levers that institutional investors should be taking into account:
- Increased monitoring of issuance flows
The imbalance between the public and private sectors can create valuation opportunities or risks of overvaluation. Understanding issuance volumes is becoming a strategic indicator.
- Revaluation of credit spread models
Technical factors, such as supply, demand, and regulation, may temporarily supersede economic fundamentals. Traditional models must adapt to new market forces.
- Strategic positioning
In an environment where credit spreads are narrowed, active management of duration, credit and liquidity is increasingly important to maintain risk-adjusted performance.
Fixed Income Team
This document was prepared by Desjardins Global Asset Management Inc. (DGAM), for information purposes only. The information included in this document is presented for illustrative and discussion purposes only. The information was obtained from sources that DGAM believes to be reliable, but it is not guaranteed and may be incomplete. The information is current as of the date indicated in this document. DGAM does not assume any obligation whatsoever to update this information or to communicate any new fact concerning the subjects, securities or strategies discussed.
The information presented should not be construed as investment advice, recommendations to buy or sell securities, or recommendations for specific investment strategies. Under no circumstances should this document be considered or used for the purpose of an offer to purchase units in a fund or any other offer of securities in any jurisdiction. Nothing in this document constitutes a declaration that any investment strategy or recommendation contained herein is appropriate for an investor's circumstances. In all cases, investors should conduct their own verification and analysis of this information before taking or refraining to take any action with respect to the securities, strategies and markets that are analyzed in this report.
No investment decisions should be based solely on this document, which is no substitute for due diligence or the required analyses on your part to justify a decision to invest.